Unlocking Your Repeat Purchase Rate Formula for Lasting Growth
Master the repeat purchase rate formula with our guide. Learn how to calculate, interpret, and boost this crucial metric for sustainable business success.
The simple repeat purchase rate formula is: (Number of Repeat Customers ÷ Total Customers) × 100. This powerful metric reveals the percentage of your customer base that liked your product enough to come back for another purchase within a specific timeframe.
Why Your Repeat Purchase Rate Is More Than Just a Number

It’s easy for e-commerce brands to get caught up in the thrill of acquiring new customers and watching top-line revenue climb. But one of the most honest indicators of your brand's health is often hiding in plain sight.
Your repeat purchase rate isn't just another KPI. It’s a direct reflection of customer satisfaction and a gut check on your product-market fit. It answers the one question that truly matters: "Did we deliver an experience worth repeating?"
A high rate is a clear sign you’re on the right track. Your products are hitting the mark, your brand is connecting, and the entire experience is good enough to earn a second purchase. On the flip side, a low rate is an early warning light on your dashboard—a signal to investigate everything from product quality and pricing to your post-purchase support.
To get started, you'll need two core pieces of data. This quick-reference table breaks them down.
Breaking Down the Repeat Purchase Rate Formula
| Component | Definition | Example |
|---|---|---|
| Repeat Customers | The number of unique customers who made more than one purchase during a specific period. | You had 1,000 unique customers in April, and 200 of them also made a purchase in March. Those 200 are repeat customers. |
| Total Customers | The total number of unique customers who made at least one purchase during the same period. | You had 1,000 unique customers who bought something in April, regardless of whether it was their first or fifth purchase. |
With these two numbers, you have everything you need to calculate your baseline repeat purchase rate.
The Financial Backbone of a Healthy Brand
Calculating this rate reveals the real financial impact of loyalty. You've probably heard it before, but it bears repeating: acquiring a new customer is wildly more expensive than keeping an existing one—often five times more.
This makes your repeat customers the true financial engine of your brand. They’re your most profitable segment, needing far less marketing spend to convert and often contributing to a higher average order value over time.
A healthy repeat purchase rate isn't just about loyalty; it's a direct indicator of sustainable profitability. It proves your business model can thrive beyond one-time transactions and expensive acquisition cycles.
This metric became a cornerstone of e-commerce analytics for good reason. It gained serious traction as brands shifted from chasing one-off sales to building real customer lifetime value (CLV), a trend that accelerated after the 2008 financial crisis. Back then, keeping customers was far more cost-effective than finding new ones. Research later confirmed just how valuable they are, with studies showing that repeat customers spend 67% more on average than new ones. For more on this historical shift, Wall Street Prep offers some great insights.
A Clear Signal of Product-Market Fit
At the end of the day, the repeat purchase rate is one of the most honest metrics you have. It cuts through the noise of vanity metrics and gives you a clear, unfiltered signal straight from your customers.
When a customer votes with their wallet a second time, it’s the strongest endorsement you can possibly get. This one number tells a powerful story about your brand's ability to build relationships that actually last.
Practical Ways to Calculate Your Repeat Purchase Rate
Now that you know why repeat purchase rate matters, let's get our hands dirty and actually calculate it. Getting a real number for your business is easier than you might think, and you don't need to be a data scientist to do it.
We'll walk through three common methods, from a quick back-of-the-napkin calculation to a more robust SQL query. To keep things consistent, we'll use the same example for each.
Let's imagine you run a small online candle store. In the first quarter of the year (January 1 to March 31), you had 1,200 unique customers place an order. Digging a little deeper, you find that 300 of those customers had shopped with you before.
With these two numbers, we're ready to go.
The Quick Manual Calculation
For a fast pulse check, you don't need any fancy software. All you need are your two key numbers and a calculator. This is perfect for getting a high-level snapshot of your performance.
Here’s what you need:
- Number of Customers with 2+ Purchases: 300
- Total Unique Customers: 1,200
Now, just plug them into the formula:
(300 Repeat Customers ÷ 1,200 Total Customers) × 100 = 25%
And there you have it. In Q1, one out of every four shoppers was a returning customer. This simple math gives you a powerful baseline. While it won't replace a deeper analysis, it’s a fantastic starting point.
Using Excel or Google Sheets
For most e-commerce managers, spreadsheets are home base. A tool like Excel or Google Sheets gives you a way to work with raw data from your sales platform (like Shopify or WooCommerce) without needing to write code.
Here’s a simplified game plan:
- Export Your Data: First, pull a list of all transactions for your chosen time frame (Q1 in our case). You'll want columns for
CustomerIDandOrderID. - Find Your Unique Customers: In a new column, a function like
=UNIQUE()will generate a clean list of every individualCustomerID. The total count here is your denominator—for our candle store, that’s 1,200. - Count Each Customer's Purchases: Next, use the
COUNTIF()function. This will look at your original transaction list and tally up how many times each uniqueCustomerIDappears. - Isolate the Repeat Buyers: Now, just filter that count column to show only customers with a value greater than 1. The number of rows left is your repeat customer count—which would be 300 in our example.
- Do the Final Math: Divide the repeat count by the total unique customer count:
(300 / 1200) * 100gets you back to that 25% repeat purchase rate.
This spreadsheet method is great because it forces you to look at the raw data, which can help you spot any weird inconsistencies. It strikes a nice balance between a quick manual count and a more technical approach.
It's also worth noting how this metric differs from a similar one. While repeat purchase rate focuses on the act of buying again, you might also want to track the overall stickiness of your customer base over time. For that, you’ll want to check out our guide on how to calculate customer retention rate.
Running a SQL Query
If your business is sitting on a large database, then SQL is your best friend. It's by far the most efficient and scalable way to calculate your repeat purchase rate. A well-written query can pull the exact numbers you need in seconds, directly from the source.
Let's say you have a transactions table with columns like customer_id and order_id. The query would look something like this:
WITH CustomerOrderCounts AS ( SELECT customer_id, COUNT(DISTINCT order_id) AS order_count FROM transactions WHERE order_date BETWEEN '2024-01-01' AND '2024-03-31' GROUP BY customer_id ) SELECT (COUNT(CASE WHEN order_count > 1 THEN customer_id END) * 100.0) / COUNT(customer_id) AS repeat_purchase_rate FROM CustomerOrderCounts; What this query does is pretty straightforward. It first counts the orders for each customer within Q1, then it calculates the percentage of those customers who placed more than one order. It’s clean, precise, and easy to run again and again, making it the gold standard for ongoing tracking.
So, What's a Good Repeat Purchase Rate?
You've run the numbers, you have your repeat purchase rate, and now the big question looms: "Is this any good?"
Honestly, it's not a simple yes or no. A "good" rate is all about context. It shifts dramatically from one industry to another, and what’s fantastic for one brand could be a red flag for another.
Think about it: a subscription coffee brand expects monthly orders and will have a completely different benchmark than a luxury furniture store, where a customer might only make a purchase every few years. The real key is to stop chasing some universal magic number and start comparing your performance against relevant standards for your specific industry.
Finding Your Industry Benchmark
To figure out where you stand, you need to see how you stack up against others in your sector. The product's natural lifecycle and how often people typically buy it are the two biggest factors that shape these benchmarks.
Here’s a rough guide to give you a sense of the landscape:
- Consumables & CPG: It's no surprise that industries like beauty, food, and supplements see higher rates. Their products are designed to be used up and reordered. A monthly rate of 20-30% is often considered pretty strong here.
- Fashion & Apparel: This world is much more driven by trends and seasons. A healthy annual rate might fall somewhere in the 20-25% range, but you can expect it to swing with new collections and seasonal demand.
- Electronics & Home Goods: These are long-haul products. You wouldn't buy a new TV every month, so the time frame for measurement is critical. An annual repeat purchase rate of 10-15% could be a fantastic target to aim for.
One of the most common mistakes I see is a brand comparing its monthly rate to another company's annual figure. Always make sure you're comparing apples to apples. Your own sales cycle should dictate the period you analyze, and you need to find benchmarks that match both your industry and that time frame.
The method you choose to get your numbers—whether a quick manual check, a spreadsheet formula, or a more complex SQL query—also plays a role in precision, but they all point to the same vital metric.
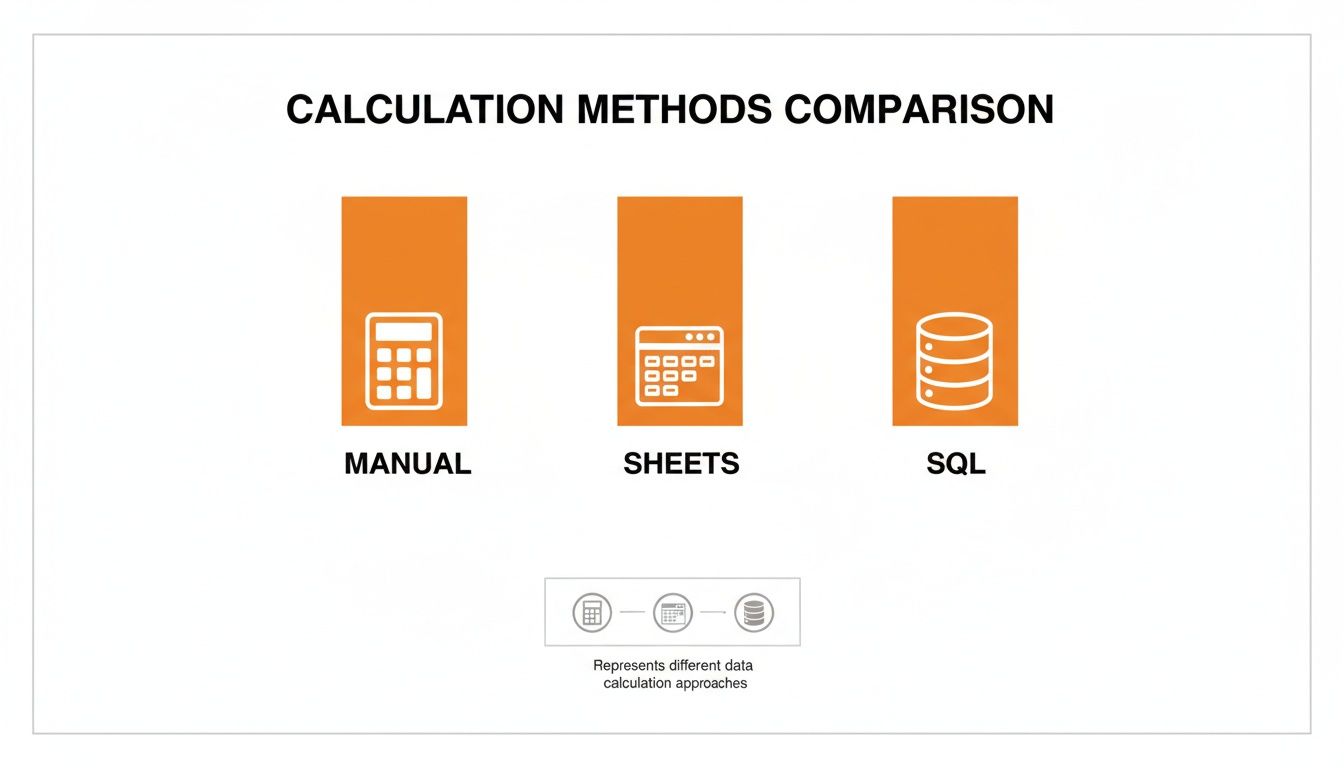
Each of these calculation methods can get you the core insight you need to understand customer loyalty.
A Look at Real-World Data and Trends
Recent data really drives home these industry differences. For consumable goods, a rate of 15% within a 60-day window is often seen as 'good.' In sharp contrast, for non-consumable goods where purchases are few and far between, a rate dipping below 10% annually could point to a serious churn problem.
This context is everything. Pre-2020 global rates hovered around 16%, but they surged to 28% after the pandemic fundamentally changed online shopping habits. By 2024, giants like Amazon Prime were pushing their repeat rates to a staggering 40-45%, completely reshaping what customers expect. If you want to dig into more of these industry-specific numbers, I'd recommend you check out the full report from Vision Labs.
At the end of the day, your most important benchmark is your own historical performance. The ultimate goal isn't just to hit an industry average, but to see steady, consistent improvement over time. That’s how you know your loyalty strategies are truly paying off.
Common Traps That Distort Your Repeat Purchase Data
Figuring out your repeat purchase rate seems straightforward on the surface, but I've seen a few common missteps completely skew the results. When you're working with a flawed number, you end up making flawed decisions—investing in the wrong retention tactics or missing the early warning signs of churn.
Getting this right is about more than just plugging numbers into a formula. You need to be crystal clear on what you're actually trying to measure.
Confusing Repeat Orders with Repeat Customers
This is hands-down the most common error I see. It's easy to mix up the number of repeat transactions with the number of repeat customers, but they tell two very different stories. The proper repeat purchase rate formula is all about the percentage of unique people who came back to buy again, not the total number of orders they placed.
Think about it: one superfan could place 10 orders in a single month. If you count every single order, your rate will look incredible. But in reality, you only managed to retain one person.
The heart of this metric is about people, not just transactions. Always, always base your calculation on a unique
customer_IDcount, not theorder_IDcount. That’s how you’ll get a true feel for loyalty across your entire customer base.
This one detail makes all the difference in understanding how broad your customer loyalty really is.
Mismatching Your Time Frame and Sales Cycle
Another classic trap is picking a time window for your analysis that just doesn't fit your product's natural buying rhythm. If you sell mattresses, looking at a 30-day repeat purchase rate is pointless. Of course it will be zero—no one buys a mattress every month! You’d just conclude you have no loyal customers, which is completely wrong.
On the flip side, a coffee subscription brand that only looks at its repeat rate annually could easily miss the immediate fallout from a price hike or a competitor's big promotion.
To get this right, you have to think like your customer:
- For consumables like skincare or coffee, a monthly or quarterly view usually makes the most sense.
- For durable goods like furniture or high-end electronics, an annual or semi-annual timeframe will give you a much more realistic picture.
The goal is simple: choose a period that gives customers a genuine, reasonable opportunity to make that second purchase.
Ignoring Crucial Customer Segments
Relying on a single, blended repeat purchase rate for your entire business is like trying to navigate with a blurry map. It can hide some serious problems lurking just beneath the surface. For instance, your overall rate might look like a healthy 25%, but what if a closer look reveals that your highest-spending VIP customers have a repeat rate of only 5%? That’s a five-alarm fire you would have otherwise missed.
This is exactly why segmentation is your best friend. By slicing your data into meaningful groups, you can start to uncover the real story. A fantastic way to do this is by grouping customers based on the month they first purchased. Our guide on what cohort analysis is walks you through this method, showing you how to track how loyalty changes for different customer groups over their entire lifecycle.
Proven Strategies to Get Customers Coming Back
Turning your repeat purchase rate from just another number on a dashboard into a real business asset takes a solid plan. It’s rarely about some grand, overnight transformation. Instead, it’s about consistently implementing smart strategies that make your customers feel seen and appreciated.
The goal here is simple: build a relationship that lasts long after that first transaction. Forget the generic advice you’ve heard a thousand times. The tactics that actually move the needle are often the simplest ones, executed with care and precision.
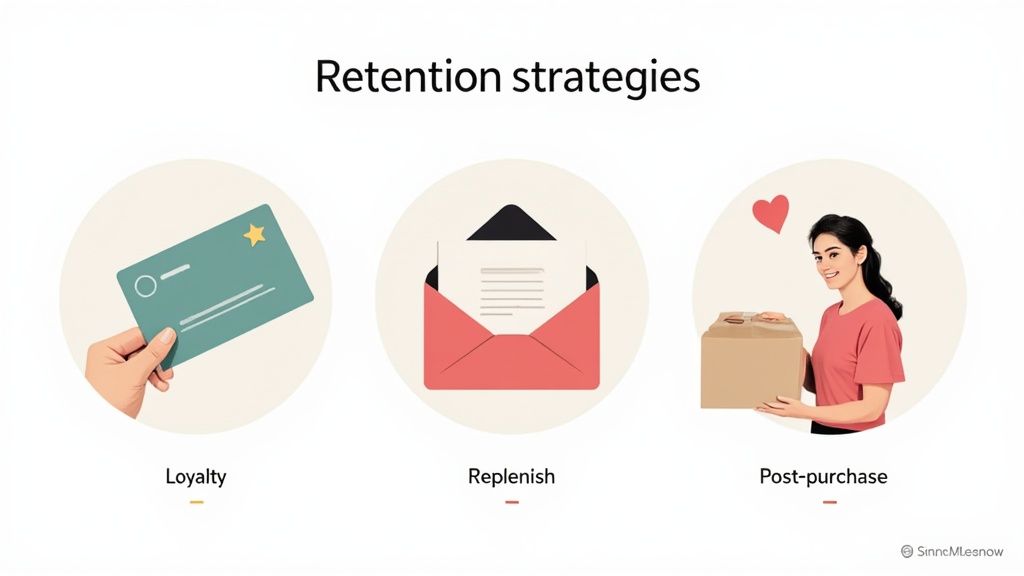
Launch a Loyalty Program That Rewards Real Fans
One of the most straightforward ways to lift your repeat purchase rate is to give customers a compelling reason to return. A well-thought-out loyalty program does just that. It's about more than just dangling discounts; it's about building a community and genuinely rewarding people for their continued support.
Think beyond the basic points-for-purchase model. Modern loyalty programs create real value through a sense of exclusivity and deeper engagement.
- Tiered Memberships: Create levels—think Bronze, Silver, and Gold—that unlock better perks as customers spend more. This gives them a clear path forward and a tangible incentive to stick with your brand.
- Exclusive Access: Treat your members like insiders. Give them early access to new product drops, invite them to members-only sales, or share exclusive content.
- Experiential Rewards: Move beyond the discount code. Offer rewards that feel special, like a free gift with their next order, a personalized consultation, or access to a private community forum.
Platforms like Toki are built to help brands create these kinds of engaging systems from the ground up. To really get into the weeds, check out our complete guide on how to create a customer loyalty program that your audience will actually love.
Master the Art of Personalized Communication
Great communication is the glue that holds customer relationships together. The trick is to be relevant and timely, not just loud. Personalized email and SMS campaigns can turn a one-time buyer into a lifelong advocate by anticipating what they need before they even ask.
A classic example is the replenishment reminder. If you sell coffee, skincare, or any other consumable product, a perfectly timed email just before they're about to run out is incredibly powerful. It feels like a helpful service, not just another sales pitch.
A great post-purchase experience is your single best marketing tool. It solidifies the customer’s decision, builds trust, and sets the stage for their next purchase before they’ve even thought about it.
This is where the repeat purchase rate formula provides the insights that fuel your strategy. For instance, an analysis found that a store with 1,000 customers and 300 repeat buyers hit a 30% rate, landing it in the top 10% of Shopify stores. That kind of success is often tied directly to loyalty initiatives—some platforms even report a 50% repeat purchase rate for brands using their systems.
Perfect Your Post-Purchase Experience
The moments immediately after a customer clicks "buy" are absolutely critical. This is your chance to either cement their trust or introduce a bit of buyer's remorse. A smooth, reassuring post-purchase journey confirms they made the right choice.
To nail this, focus on three key areas:
- Proactive Customer Service: Don’t wait for them to come to you with problems. Send clear shipping updates and follow up to make sure they're happy with their order.
- Hassle-Free Returns: Nothing kills the vibe like a complicated or costly return process. Make it simple, transparent, and, if you can swing it, free.
- Thoughtful Touches: Small details can leave a huge impression. A personalized thank-you note, a surprise sample, or even just beautiful packaging can make the entire experience memorable.
Beyond these foundational steps, layering in powerful customer retention marketing tactics is essential for building the kind of loyalty that lasts.
Common Questions About Repeat Purchase Rate
When you start digging into the repeat purchase rate, a few common questions always seem to pop up, especially when trying to distinguish it from other metrics you're already tracking. Let's clear up some of that confusion so you can use this metric effectively.
Repeat Purchase Rate vs. Customer Retention Rate: What's the Difference?
This is probably the most common mix-up. While they sound like they measure the same thing, they actually track two very different aspects of customer loyalty.
The repeat purchase rate is purely transactional. It’s laser-focused on one simple question: "What percentage of our customers came back to buy something again in a specific timeframe?" It's all about the action of the second purchase.
Customer retention rate, however, is broader. It measures how many customers you've kept over a period, regardless of their purchase activity. Someone could be considered "retained" because they haven't unsubscribed from your email list or cancelled their account, but they only count toward your repeat purchase rate once they actually click "buy" again.
Think of it this way: Retention is about keeping the relationship alive. Repeat purchase rate is about seeing that relationship translate into another sale. You need both, but they tell you different stories.
How Often Should I Be Calculating This?
There's no magic number here—the right frequency is tied directly to your business model and your product's natural buying cycle. Calculating it too often or not often enough can give you a warped view of reality.
A solid rule of thumb is to match your calculation window to how long it would realistically take a customer to need your product again.
- Monthly or Quarterly: This works great for consumables with a quick turnaround. Think coffee, skincare products, or vitamins. People run out and reorder on a predictable schedule.
- Annually or Semi-Annually: If you sell things people buy infrequently, this is a much better fit. No one is buying a new mattress, sofa, or high-end laptop every month.
The goal isn't just to calculate it frequently, but to be consistent and choose a timeframe that genuinely reflects how your customers behave.
Can a High Repeat Purchase Rate Ever Be a Bad Thing?
It’s almost always a good sign, but yes, it can be misleading if you look at it in isolation. A high repeat purchase rate doesn't automatically mean your business is thriving.
Imagine a scenario where your repeat rate is fantastic, but it’s coming from a tiny, shrinking segment of super-loyal customers. If you aren't bringing in any new customers, the business is slowly dying, despite the great loyalty metric.
Likewise, you could have strong repeat business, but if your Customer Acquisition Cost (CAC) is sky-high or your Average Order Value (AOV) is in the basement, you might be losing money on every customer.
Always pair your repeat purchase rate with other key health metrics like Customer Lifetime Value (CLV), CAC, and overall revenue growth. That’s how you get the full story.
Ready to turn one-time buyers into lifelong fans? Toki provides all the tools you need to build a powerful loyalty and rewards program that boosts your repeat purchase rate. Start building lasting customer relationships today.