How do you calculate customer retention rate: Quick guide
How do you calculate customer retention rate? Learn the formula, see practical examples, and interpret your metrics to boost loyalty.
To figure out your customer retention rate, you're essentially tracking how many customers stick with you over a set period. The key is to ignore any new customers you picked up during that time. This number gives you a direct, unfiltered look at customer loyalty and satisfaction, acting as a real health check for your business.
Why Customer Retention Is Your True North Metric
Before we get into the math, let's talk about why this metric is so critical. Your Customer Retention Rate (CRR) isn't just another KPI to stick on a dashboard; it's a vital sign for your entire operation. It tells you, in no uncertain terms, how well you're delivering on your promises and keeping customers happy enough to stay.
A high retention rate is the bedrock of sustainable growth. Think about it. You could have an e-commerce store that's constantly hemorrhaging cash on ads to bring in new shoppers, or you could have one that focuses on nurturing its existing customer base. That second store is building a predictable, profitable business that isn't at the mercy of volatile acquisition costs.
The Real-World Impact of Strong Retention
Shifting your focus to retention isn't just a feel-good strategy. It has tangible, powerful benefits that go straight to your bottom line.
- Lower Acquisition Costs: We’ve all seen the stats, but they bear repeating. Acquiring a new customer can cost anywhere from 5 to 25 times more than keeping an existing one. A solid CRR means you can hit your revenue targets without breaking the bank on marketing.
- Increased Profitability: Here's where it gets really interesting. Loyal customers don't just stick around; they tend to spend more over time. Research from Bain & Company shows that boosting retention by just 5% can lift profits by 25% to 95%. That's a massive return.
- Predictable Revenue: A stable base of repeat buyers creates a reliable revenue stream. This makes it infinitely easier to forecast, set budgets, and confidently invest in growing your business.
A business's real asset is its loyal customer base. Retention isn't an activity; it's the result of every single interaction a customer has with your brand. It’s the ultimate proof that you’re delivering value worth coming back for.
Retention as the Opposite of Churn
At the end of the day, retention and churn are two sides of the same coin. Churn tracks how many customers you lose, which can feel deflating. Retention, on the other hand, celebrates how many you keep. It’s a positive, goal-oriented metric you can rally your whole team around.
This focus shifts your mindset from simply plugging a leaky bucket to actively building a more engaging and valuable experience. It’s a crucial step in building long-term customer relationships and is fundamental if you want to increase customer lifetime value and turn happy customers into passionate brand advocates.
The Standard Customer Retention Rate Formula
Calculating your customer retention rate isn't about getting lost in complex spreadsheets. It's about getting a clear, honest look at customer loyalty. The whole point of the formula is to see how many of your existing customers are sticking around, completely separate from any new faces you brought in.
The standard formula for this is refreshingly simple:
CRR = [ (E - N) / S ] x 100
Looks easy enough, right? The key is just making sure you're pulling the right numbers. Let's break down what each letter actually means.
Defining the Core Variables
Before you can plug anything in, you need to define your timeframe. Are you looking at last month? The last quarter? The entire year? Once you’ve decided, you can pull the data.
Here's what you're looking for:
- S (Start): This is your total customer count on day one of the period. If you're calculating for Q2, this is the number of customers you had on April 1st.
- E (End): This is the total number of customers you have on the very last day of that same period.
- N (New): Here's the important one. This is the number of brand-new customers you acquired during that period.
The biggest mistake people make is forgetting to subtract new customers (N). If you don't, you’re muddying the waters by mixing new acquisitions with your loyal base. The whole exercise is to see how many of the original group (S) actually stuck around.
To make this even clearer, here’s a quick reference table.
Breaking Down the Customer Retention Formula
This table puts all the variables in one place, so you can easily see what each part of the formula represents.
| Variable | What It Represents | Example Data |
|---|---|---|
| S | Customers at the Start of the period | 1,200 customers on Jan 1st |
| E | Customers at the End of the period | 1,350 customers on Mar 31st |
| N | New customers acquired during the period | 250 new customers from Jan-Mar |
With this data, you can see how the numbers fit together to give you a clear picture of loyalty, not just overall growth.
A Practical Example of Calculating CRR
Let’s put this into action with a real-world scenario. Imagine you run an e-commerce store with an artisanal coffee subscription, and you want to check your retention for the first quarter (Q1).
Here’s your data for Q1:
- Customers at the Start (S): On January 1st, you had 1,200 active subscribers.
- Customers at the End (E): By March 31st, your total subscriber count was 1,350.
- New Customers Acquired (N): Over those three months, you signed up 250 new coffee lovers.
Now, let's plug those numbers into the formula:
CRR = [ (1,350 - 250) / 1,200 ] x 100
First, find out how many of your original customers are still there.
1,350 - 250 = 1,100
So, of the 1,200 customers you started with, 1,100 are still subscribed. That's the number that truly reflects retention.
Next, divide that by your starting customer count:
1,100 / 1,200 = 0.9167
Finally, turn that decimal into a percentage:
0.9167 x 100 = 91.67%
Your customer retention rate for Q1 is 91.7% (rounded up).
This simple calculation tells a powerful story: you kept nearly 92% of the customers you had at the start of the year. This is a foundational metric because it isolates loyalty from acquisition, giving you a much truer measure of customer health. If you want to dive deeper into the financial implications, Wall Street Prep has some excellent resources on how this formula is used in business analysis. This single percentage is your baseline for understanding just how happy your customers really are.
Analyzing Retention Across Different Timeframes
Calculating your customer retention rate once gives you a snapshot. But to really get the full picture of customer loyalty, you need to look at it over time. The real insights come from tracking this metric monthly, quarterly, and annually, because each timeframe tells a different part of the story about your business and your customers' behavior.
Think about it this way: a SaaS company running on monthly subscriptions needs to watch its monthly retention like a hawk. Even a small dip could mean a new feature flopped or a competitor just launched a new marketing blitz. On the other hand, an e-commerce store that sells big-ticket furniture might find quarterly analysis more useful, as it smooths out the natural ebbs and flows of a longer sales cycle.
This infographic breaks down the basic formula, showing you exactly which customers to count.
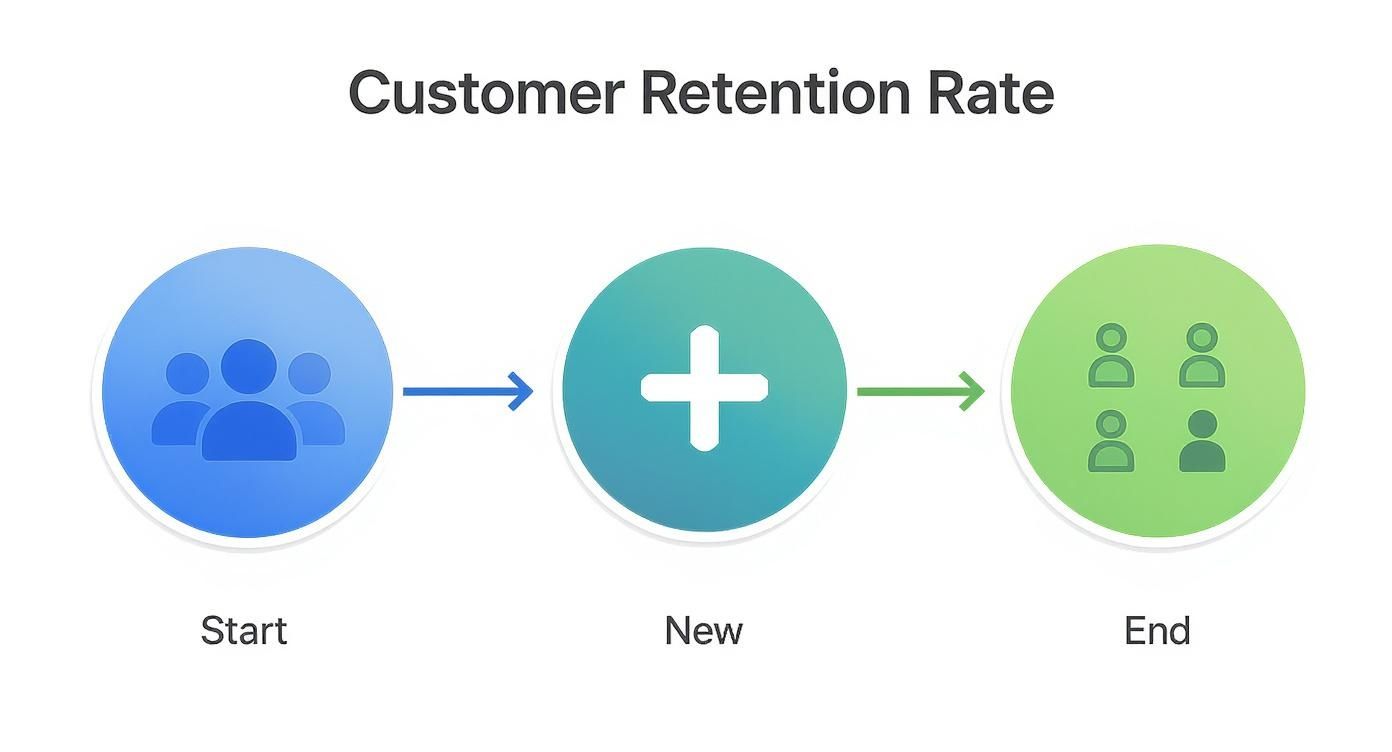
As you can see, the key is to separate your existing customers from new ones to get a true reading on retention.
The Compounding Effect of Churn
Here’s something that trips up a lot of business owners: the compounding nature of churn. A monthly churn rate of 3% might not sound alarming, but its impact isn't just 3% over the year. It's much, much worse. The loss snowballs because you start each new month with a smaller customer base.
The true cost of churn is exponential. Small, consistent losses add up to significant revenue leaks over time, making even minor improvements in monthly retention incredibly valuable for long-term stability.
Let's run the numbers to see how this plays out. The formula you need is:
Annual Retention Rate = (1 - Monthly Churn Rate)^12
With a 3% monthly churn, your monthly retention is 97%. Plug that into the formula, and you find your annual retention rate is just 69.4%. That’s a staggering loss of over 30% of your customers in a single year from what seemed like a tiny monthly drop.
From Monthly Dips to Annual Trends
This is precisely why looking at the long-term view is so critical for strategy. A monthly retention rate of 95% feels great, but when you run it through the annual formula—(0.95)^12—you're left with an annual rate of about 54%. Suddenly, the picture of long-term loyalty looks very different.
Tying your analysis to different timeframes helps you connect the dots between your actions and their results.
- Monthly: This is perfect for seeing the immediate results of a new marketing campaign, a product update, or a change in your customer service process.
- Quarterly: This view helps you spot broader trends by smoothing out any random monthly noise. It gives a clearer signal on how your bigger strategic moves are working.
- Annually: This is the ultimate health check for your business, showing the high-level reality of customer loyalty over the long haul.
Looking at retention this way gives you a much richer, more actionable story than a single number ever could. To get even more granular, you can segment customers into groups and track their behavior over time. Our guide on https://www.buildwithtoki.com/blog-post/what-is-cohort-analysis is a great place to start. And once you have a handle on keeping customers, the next logical step is to learn how to calculate customer lifetime value to understand what those loyal customers are truly worth.
So, you've calculated your customer retention rate and now you have a percentage staring back at you. What does that number actually mean? Is it good? Is it bad?
The honest answer: it depends.
A "good" customer retention rate isn't some universal number pulled from a textbook. It’s completely tied to your industry, your specific business model, and even the lifecycle of your products.
https://www.youtube.com/embed/OwCATJh4lNg
Think about it. An e-commerce brand selling coffee or skincare—things people buy repeatedly—should have a much higher monthly retention rate than a company selling mattresses. You don't buy a new mattress every month. Context is everything.
A Quick Look at Industry Benchmarks
While the best comparison is always against your own history, it's still helpful to have a general sense of where you stand in the wider market. Industry benchmarks can give you a rough baseline, but don't treat them as gospel.
Here are some annual retention rate averages that get thrown around:
- Retail & E-commerce: Tends to sit around 63%. Loyalty can be tough to earn when a competitor is just a click away.
- SaaS: Usually much higher, often between 92% to 97% annually. Subscription models are naturally stickier.
- Media & Entertainment: Averages about 84% as streaming services fight to keep subscribers hooked.
- Financial Services: This sector is a beast, often hitting over 84%. Let's be real, switching banks is a hassle, which works in their favor.
As you can see, what's considered "good" is all over the map. An 85% retention rate is fantastic in the media world, but it would probably trigger a few panic attacks at a B2B SaaS company.
The Only Benchmark That Truly Matters: You vs. You
External numbers are interesting, but your own historical performance is the single most valuable yardstick you have. The real mission isn't to chase some arbitrary industry average—it's to get better, consistently.
Your most important benchmark is your own past performance. Aiming to improve your retention from 82% to 85% quarter-over-quarter is a far more meaningful and actionable goal than chasing a vague industry standard.
When you track your CRR over time, you can see the real-world impact of your strategies. Did that new loyalty program you rolled out actually move the needle? Did that tweak to your customer onboarding flow stop new users from bailing?
This is how you turn retention from a static number on a dashboard into a powerful tool for making smart decisions.
Ultimately, a good customer retention rate is one that's trending upwards. It's the clearest sign that you're delivering value, listening to your customers, and building a much healthier, more sustainable business. Focus on beating your own score. That's how you win.
How to Improve and Track Your Retention Efforts
Figuring out your customer retention rate is just the start. The real magic happens when you turn that number into a strategic advantage by actively working to improve and track it. Sure, you can start by crunching the numbers in a spreadsheet, but that's not a long-term solution. It's time-consuming, prone to errors, and won't give you the real-time insights you need to make quick decisions.
This is exactly why dedicated analytics tools are so crucial. An analytics dashboard automates the whole process. Instead of spending hours pulling reports, you can see your CRR, cohort trends, and other vital metrics update in real-time. This frees you up to focus on what actually matters: building strategies that keep your customers coming back.
A good dashboard, for example, lets you visualize your retention data, making it easy to spot trends at a glance.
When your data is laid out visually like this, you can immediately see if that new campaign you launched or a recent change to your checkout process had a positive or negative impact on loyalty.
Actionable Strategies to Boost Your CRR
Once you have a solid system for tracking, you can start implementing tactics designed to actually move the needle. You'll find that effective retention isn’t about one-off grand gestures; it’s about consistently delivering value and making your best customers feel seen.
Here are a few powerful strategies that we’ve seen work time and time again:
- Build a Tiered Loyalty Program: Ditch the basic "earn points" system. A tiered program, where customers unlock new perks and statuses as they spend more, gamifies the experience. Think exclusive access, early product drops, or special discounts that make them feel like genuine VIPs.
- Launch Personalized Re-Engagement Campaigns: Don't just let at-risk customers fade away. Use your data to pinpoint shoppers who haven't bought anything in a while and hit them with a targeted "we miss you" campaign. An offer for 15% off their favorite product category is far more compelling than a generic newsletter blast. For a deeper dive, look into mastering personalization in email marketing to make every message resonate.
- Solicit and Act on Customer Feedback: The easiest way to find out what your customers want is simply to ask them. Use post-purchase emails, surveys, and even social media polls to gather feedback. The crucial part? Show them you’re actually listening by implementing their suggestions and letting them know you did.
A loyalty program isn't just a marketing tactic; it's a customer relationship tool. It formalizes the value exchange between your brand and your customers, turning transactional shoppers into a community of advocates.
Connecting Metrics to Marketing Actions
The ultimate goal here is to draw a clear line between your retention metrics and the specific marketing actions that influence them. Every initiative you launch—from a new loyalty tier to a win-back email—is an experiment. By keeping a close eye on your CRR and other related KPIs, you can see what’s working and double down on those strategies.
For example, after launching a referral program, don't just track new customer acquisition. Monitor the retention rate of both the person who made the referral and the new customer they brought in. If both groups show high retention, that’s a powerful sign that your program is attracting the right kind of loyal customers. Our guide on key https://www.buildwithtoki.com/blog-post/customer-retention-kpis can help you figure out exactly which metrics to watch.
This data-driven approach is what transforms retention from a passive number you check once a quarter into an active, strategic part of your growth engine.
Common Questions About Calculating Customer Retention
Once you start calculating retention, you’ll quickly run into a few tricky situations that the basic formula doesn't quite cover. What about holiday-only shoppers? And what’s the real difference between retention and churn, anyway?
Let's unpack some of the most common questions that pop up.
How Do You Handle Seasonal Shoppers?
One of the biggest wrenches in retention math for e-commerce brands is seasonality. Think about it: a customer who buys a specific gift from you every single December is incredibly loyal. But if you're only looking at monthly or quarterly retention, they'll look like a "churned" customer for the other eleven months of the year.
This is where a simple, top-level CRR can lead you astray.
The best way to get a true read on these customers is with cohort analysis. Instead of lumping everyone together, you group customers by the month they first bought something. This lets you see if your December 2022 cohort came back in December 2023. That’s a far more powerful insight than seeing your overall retention dip in January.
Retention Rate vs. Churn Rate
This one comes up all the time, but thankfully, the answer is simple. Customer retention rate and churn rate are just two sides of the same coin. They measure the exact same thing, just from opposite angles.
- Retention Rate: The percentage of customers you keep.
- Churn Rate: The percentage of customers you lose.
They're a perfect mirror image. If your retention rate for a period is 85%, your churn rate is automatically 15%. You don’t need another complicated formula.
Churn Rate = 100% - Customer Retention Rate
Thinking about it this way keeps your reporting clean and simple. When retention goes up, churn goes down. It's a direct relationship that gives you a complete picture of customer loyalty.
Should You Track Customers or Revenue?
So, should your focus be on the number of customers you keep or the revenue they bring in? The standard Customer Retention Rate tracks the headcount, which is a fantastic starting point.
But for businesses with variable spending—especially subscription models or B2B—a more advanced metric is Net Revenue Retention (NRR).
NRR tells you how much revenue you've kept from your existing customer base, factoring in both expansions (like upgrades or cross-sells) and contractions (like downgrades). It answers a crucial question: "If we didn't sign a single new customer this year, would our revenue from last year's customers have grown or shrunk?"
An NRR over 100% is the gold standard. It means your existing customers are spending more with you over time—a powerful sign of a healthy, sticky product. While CRR is essential for virtually everyone, NRR adds a layer of financial context that's incredibly valuable.
Ready to turn these insights into action? Toki provides the analytics and loyalty tools you need to not only track your retention rate but actively improve it. See how our platform can help you build a loyal customer base that drives predictable growth. Start your journey with Toki today!