What is Cohort Analysis? Boost Your Business Insights Today
Learn what is cohort analysis and how it can help improve retention and drive growth. Discover real examples and practical tips now!
Think of your customer base as a massive, bustling crowd. Trying to understand everyone at once is nearly impossible—it’s just a sea of faces. You can see general movement, but you miss the crucial details. What if you could ask everyone who arrived in January to take one step forward? Then everyone from February? Suddenly, you're not looking at a chaotic crowd anymore. You're seeing distinct groups, and you can start to understand their unique journeys.
That, in a nutshell, is cohort analysis.
What Is Cohort Analysis?

Instead of looking at your business metrics as one big, messy average, cohort analysis lets you group users based on a shared experience. Most often, that shared experience is when they started using your product or made their first purchase.
So, you end up with cohorts like the "January 2024 New Customers," "February 2024 New Customers," and so on. It’s like creating a "graduating class" for each month or week. This simple act of grouping customers completely changes the questions you can answer.
Instead of asking, "Why is our overall retention flat?" you can now ask, "Did the customers we acquired during our big Black Friday sale stick around longer than the ones from our spring campaign?" or "How did last quarter's website redesign impact the spending habits of new users versus our existing ones?"
This shift from a blurry, all-in-one view to a sharp, group-by-group perspective is where the magic happens. For a more formal definition, you can check out this simple explainer on Cohort Analysis.
The Building Blocks of a Cohort
At its heart, cohort analysis is a way to see how specific changes—like a new marketing campaign, a product update, or even a seasonal trend—truly affect customer behavior and loyalty over time. It’s an essential tool for any e-commerce business, especially for Toki customers wanting to prove the long-term impact of their loyalty initiatives.
To really get it, you just need to understand three core components that make up any cohort. We've broken them down in the table below to show you how these simple pieces come together to form a powerful analytical framework.
Core Components of a Cohort
| Component | Description | E-commerce Example |
|---|---|---|
| Shared Trait | The common characteristic that groups users together. | All customers who made their first purchase in May. |
| Acquisition Period | The specific timeframe when the cohort was formed. | The first week of a new product launch. |
| Behavioral Metric | The key action or metric you track over time. | The percentage of users from that group making a second purchase. |
Once you have these building blocks in place, you can start tracking the "Behavioral Metric" for each "Acquisition Period" cohort over time. This creates a clear picture of how different groups of customers behave, revealing trends you would have otherwise missed entirely.
Uncovering Trends From Medicine to Marketing
To really get what makes cohort analysis so powerful, you have to look beyond the world of business. The secret to understanding customer behavior today wasn't born in a Silicon Valley startup—it actually started in a medical lab. Long before marketers were tracking user lifecycles, epidemiologists were using this exact method to make massive breakthroughs in public health.
This approach was famously used in major health studies like the Framingham Heart Study. Back in 1948, researchers started tracking a group of 5,209 people to see what caused heart disease. They didn't just stop there; they followed that original group for decades, eventually adding new cohorts of their children and grandchildren. This gave them an incredibly clear picture of how things like genetics and lifestyle choices played out over time.
From Diagnosing Disease to Diagnosing Business Health
The idea behind it was brilliantly simple. If you group people together based on a shared starting point and watch what happens to them, you can draw direct lines between their actions and the outcomes. It’s this very same thinking that the sharpest e-commerce brands now use to check the "health" of their own customer base.
Think about it. Instead of tracking risk factors for an illness, a business is tracking metrics like:
- Purchase Frequency: Are customers from our holiday sale one-and-dones, or do they come back?
- Customer Lifetime Value (CLV): How much is the cohort we acquired in May worth compared to the one from June?
- User Engagement: Do customers who signed up via our Instagram campaign stick around longer than those from a Google ad?
Suddenly, you’re not looking at vague, company-wide averages that can hide major problems. You're looking at the specific behaviors of individual groups, which gives you clear, actionable insights. You can finally see what actually drives loyalty and—just as crucial—what makes people leave.
By applying a medical research framework to business data, you stop guessing and start knowing. You’re no longer just treating symptoms like a dip in sales; you’re finding the root cause within a specific group of customers.
This level of detail is a game-changer for making smarter decisions. For example, if you know which marketing channels bring in the most valuable customers over the long haul, you know exactly where to put your budget. Pinpointing where a certain cohort loses interest is the first step toward building e-commerce customer retention strategies that actually work.
For Toki customers, this means you can see precisely which loyalty program features excite your newest users and then focus on giving them more of what keeps them coming back for more.
Choosing the Right Cohort for Your Business
The magic of cohort analysis isn't just in running the report; it's in asking the right questions. And to do that, you have to group your customers in a way that actually makes sense for what you're trying to figure out. How you define your cohorts will completely shape the story the data tells you.
There are a few ways to slice this, but the two main approaches are grouping users by when they started (acquisition cohorts) or by what they did (behavioral cohorts).
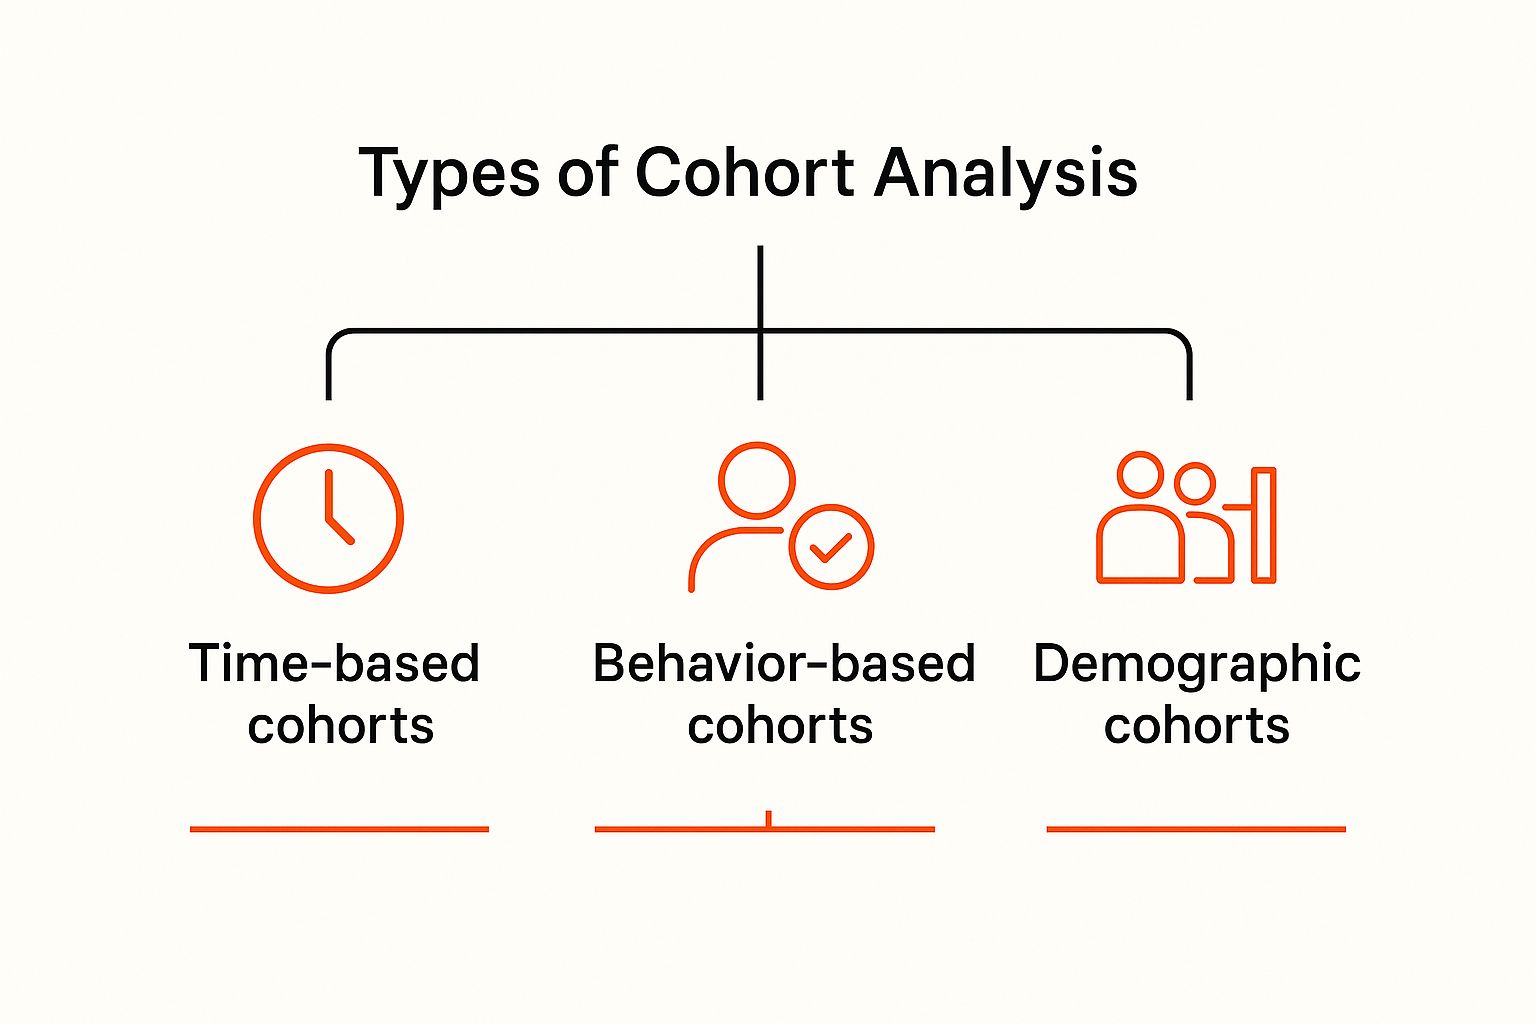
As you can see, you can group customers by time, specific actions, or even their personal attributes. Each view gives you a different lens to understand their journey.
Unpacking Acquisition Cohorts
Acquisition cohorts are the classic starting point. You simply group users based on the day, week, or month they signed up or made their first purchase. Think of them as your "Class of January," "Class of February," and so on. It’s a straightforward method that’s perfect for answering questions about timing.
For example, you could use acquisition cohorts to:
- Gauge marketing success: Did customers who came from your big Black Friday push stick around longer than those from a typical week in July?
- Measure platform updates: Are customers who signed up after your big website redesign spending more over their lifetime?
- Spot seasonal trends: Do customers who join in the summer behave differently than those who join during the holiday rush?
This approach draws a clear line in the sand, making it easy to connect business changes to the behavior of new customers who experienced them.
Diving into Behavioral Cohorts
While acquisition cohorts tell you when users showed up, behavioral cohorts help you understand why they stick around. This is where you group people based on actions they took—or didn't take—within a certain window of time. For an e-commerce brand, this is where the gold is often buried.
Behavioral cohorts get past the calendar and into the why. They help you find those "aha!" moments that turn a first-time buyer into a raving fan or pinpoint the exact friction points that make people leave.
Let’s say you want to prove your loyalty program is working. You could create two distinct behavioral cohorts:
- Cohort A: New customers who signed up for your loyalty program within their first week.
- Cohort B: New customers who did not sign up for the loyalty program.
By tracking the repeat purchase rate for both groups over the next few months, you can see the real-world impact of the program on customer loyalty. For Toki customers, this kind of analysis is incredibly powerful. It connects specific features, like your points system or referral program, directly to business results and gives you a clear road map for growth.
Measuring What Matters for Business Growth
Defining your cohorts is the first step, but the real magic happens when you start tracking the right metrics. This is where you graduate from simply grouping customers to truly understanding the vital signs of your business. Without clear metrics, a cohort analysis is just a pile of data. With them, it tells a compelling story about customer health and your company’s momentum.
Instead of getting bogged down by broad, often misleading site-wide averages, cohort analysis lets you zoom in on how specific groups behave. This focus helps you answer the questions that actually drive growth, turning raw numbers into a clear, actionable narrative.
Key Metrics for Cohort Analysis
Choosing what to measure really comes down to your strategic goals. That said, for most e-commerce brands, a handful of core indicators tell the most important parts of the story. These metrics reveal not just what customers are doing, but how valuable their actions are over the long haul.
Here are three of the most essential metrics to track for any cohort:
- Customer Retention Rate: This is the bedrock of cohort analysis. It simply measures the percentage of customers from a cohort who come back to buy again within a set period. High retention is the clearest signal you have a healthy, sticky product.
- Customer Lifetime Value (CLV): This metric calculates the total revenue a single cohort brings in over its entire lifespan. By comparing the CLV of different cohorts, you can see which acquisition channels or campaigns are delivering the most profitable customers, not just the most numerous ones.
- Purchase Frequency: This shows how often customers in a cohort are placing orders. An increasing purchase frequency is a fantastic sign that your customers are becoming more engaged and finding ongoing value in what you sell.
By focusing on these vital signs, you can start to see the bigger picture. For instance, you might discover that your "Black Friday" cohort has a lower initial retention rate but a much higher CLV, revealing they are less frequent but bigger spenders.
This is the kind of detail that’s critical for making smart decisions. It helps you grasp the nuances of customer behavior and adjust your strategy based on real evidence. To truly measure what matters, it’s essential to learn how to effectively increase customer retention using these insights.
To help you get started, here’s a quick breakdown of key metrics and the business questions they help you answer.
Essential E-commerce Cohort Metrics
A comparative look at the key metrics used in cohort analysis and the strategic business questions they help answer.
| Metric | What It Measures | Business Question It Answers |
|---|---|---|
| Customer Retention Rate | The percentage of a cohort that makes a repeat purchase over time. | Are our customers sticking around after their first purchase? |
| Customer Lifetime Value (CLV) | The total net profit attributed to the entire future relationship with a customer. | Which acquisition channels bring us the most valuable customers long-term? |
| Purchase Frequency | How often an average customer in a cohort makes a purchase. | Are our marketing efforts making customers buy more often? |
| Average Order Value (AOV) | The average amount spent each time a customer from the cohort places an order. | Are customers spending more per order over time? |
| Time to Second Purchase | The average time it takes for a customer in a cohort to make their second purchase. | How quickly are we convincing new customers to become repeat buyers? |
Thinking about these metrics as a group rather than in isolation is what unlocks the most powerful insights.
Interpreting the Story Your Data Tells
These metrics don't exist in a vacuum; they work together to paint a complete picture of customer health. For example, a high retention rate is great, but if that cohort's CLV is low, it might mean you're holding onto customers who only buy cheap items during a sale. This is where cohort analysis really shines.
Learning to read the story in your data is a game-changing skill. Digging into customer loyalty analytics can give you the framework to turn these numbers into concrete strategies. For Toki customers, this means you can directly link your loyalty program features—like points and rewards—to tangible improvements in retention and CLV for specific cohorts. You stop guessing and start proving the value your efforts create.
Putting Cohort Analysis Into Action
Knowing the theory behind cohort analysis is one thing. But the real magic happens when you use it to make smarter, data-backed business decisions. It’s time to move beyond the charts and see how this plays out in the real world for e-commerce stores.
Let's say your goal is to figure out which marketing channels bring you the best customers—not just who clicks an ad, but who actually sticks around and keeps buying. Instead of getting bogged down by surface-level metrics like initial conversion rates, you can use cohort analysis to track customer behavior over the long haul.
For instance, you could create two groups: one for new customers acquired through a paid Google Ads campaign in May, and another for customers who found you through an organic Instagram post that same month. By watching their purchase frequency and average order value over the next six months, you might find something surprising. The Google Ads group might have a higher initial conversion rate, but maybe the Instagram group shows 30% better retention and a higher lifetime value. Suddenly, you have a clear answer on where to focus your marketing budget for sustainable growth.
Measuring the True Impact of Business Changes
Another fantastic use for cohort analysis is measuring the real return on investment (ROI) of big business changes, like a complete website redesign. It’s a classic scenario: you pour a ton of resources into a slick new site, but how can you be sure it really improved the customer experience and helped your bottom line?
Cohort analysis cuts through the guesswork. It lets you create a clean before-and-after comparison of user behavior. You simply create a "pre-launch" cohort of all new customers from the month before the redesign and a "post-launch" cohort from the month after.
By analyzing their behavior side-by-side, you can get answers to the questions that matter:
- Engagement: Are the post-launch users browsing more pages per session?
- Retention: Is the new cohort sticking around longer than the old one?
- Value: Is the new group making their second purchase faster?
If your post-launch cohort shows a 15% higher retention rate by month three, you have concrete proof that the redesign worked. This is exactly the kind of data that helps Toki customers show the direct value their loyalty programs bring to the table.
Finding the ‘Aha!’ Moments That Create Fans
Finally, cohort analysis is your best friend when it comes to pinpointing those "aha!" moments—the specific actions that transform a casual visitor into a loyal, repeat customer. By creating cohorts based on behavior, you can test your hunches about what really hooks people.
You might have a theory that customers who use your "wishlist" feature within their first week are more likely to become dedicated buyers. To test this, you’d create two cohorts: one of users who used the feature and one of users who didn't.
If the data shows the "wishlist" cohort has a 50% higher lifetime value, you’ve just found a crucial aha! moment. The next step is obvious: find creative ways to get more new users to engage with that feature. Just like that, you've turned a simple insight into a powerful growth strategy.
Common Mistakes and How to Avoid Them
Cohort analysis is an incredibly powerful tool, but like any sharp instrument, you need to know how to handle it properly. It's easy to make a few common mistakes that can skew your results and lead you to the wrong conclusions. Let's walk through the most frequent pitfalls and how to steer clear of them.
One of the biggest trip-ups is analyzing cohorts that are just too small. When you're looking at a tiny group of users, any pattern you spot is likely just random chance, not a real trend. Think about it: if you tested a new feature on only five people, would you really trust the results? Of course not.
Solution: Make sure your cohorts are big enough to matter. If you don't get a lot of new users each day, don't be afraid to group them by week or even by month. This gives you a much more reliable sample size to work with.
Ignoring Outside Influences
Another classic mistake is getting tunnel vision and forgetting that the world exists outside your app or website. You might see a sudden drop in retention for your March cohort and blame a recent update, completely overlooking the fact that your biggest competitor launched a massive sale that same month.
Seasonality is another huge factor. Customers who sign up during the Black Friday frenzy are going to behave very differently than those who join in a slow, quiet month like April. If you attribute every change in behavior to your own actions, you’re missing half the story.
Confusing Correlation with Causation
This is the oldest mistake in the data analysis book, but it's especially tempting with cohort data. For instance, you might see that users who join your referral program have a 25% higher lifetime value. It’s so easy to jump to the conclusion that your referral program is a magic money-making machine.
But hold on. It could just be that your most loyal, high-spending customers were the ones most likely to sign up for the referral program in the first place. The program didn't cause their loyalty; it was a symptom of it.
Solution: Cohort analysis is fantastic for finding these interesting correlations. But to prove causation, you need to run an A/B test. Isolate a variable and test it with a control group to see if it truly moves the needle. To learn more, check out our guide on referral program best practices for tips on measuring real impact.
Answering Your Cohort Analysis Questions
Alright, you get the basic idea behind cohort analysis. But knowing the "what" is a world away from actually doing it. When the rubber meets the road, practical questions always pop up.
Let's walk through some of the most common questions people have when they move from theory to practice. My goal here is to clear up any confusion and give you the confidence to dive in.
How Do I Choose the Right Cohort Size?
This one comes up a lot, and the honest answer is: it depends on your traffic. The key is to make your group large enough to be statistically significant. In simple terms, you need enough people in the group so that the trends you see are real and not just random noise caused by a few quirky customers.
If a cohort is too small, a handful of outliers can throw off your entire analysis. As a starting point, try to get at least 100 users in each cohort. If you aren't getting that many new users every day, no problem—just expand your timeframe. Group people by the week or even by the month they signed up. The goal is to get a sample size that gives you trustworthy data.
What Tools Can I Use for Cohort Analysis?
You don't need a fancy, expensive platform to get started. You can actually perform some pretty solid cohort analysis with tools you probably already use. Spreadsheets like Google Sheets or Microsoft Excel are great for this; their pivot table functions can create basic cohort charts and get you your first insights. It's a fantastic, low-cost way to dip your toes in the water.
When you're ready for more automated and powerful analysis, you'll want to look at dedicated analytics platforms.
- General Analytics: Tools like Google Analytics, Mixpanel, and Amplitude have excellent, built-in cohort analysis features.
- E-commerce Specific: Platforms built specifically for online stores, like Toki, are a game-changer. They offer cohort tools that are already hooked directly into your customer purchase data, saving you a ton of setup time.
How Is Cohort Analysis Different from Segmentation?
This is a classic point of confusion, but the difference boils down to one simple thing: time.
Segmentation groups users based on shared attributes, like their location or lifetime value. These are often static or can happen at any point. Cohort analysis, on the other hand, always has a time component. It’s a very specific type of segmentation.
Cohort analysis is behavioral segmentation where the shared trait is a specific action taken within a specific timeframe. It groups users by a shared start date (like their first purchase in June) and then tracks what they do over the following days, weeks, or months.
Think of it this way: all cohorts are segments, but not all segments are cohorts.
Ready to see how cohort analysis can reveal what truly drives loyalty for your brand? With Toki, you can track customer behavior, measure the impact of your loyalty programs, and turn insights into repeat sales. Explore how our advanced analytics can help you build lasting customer relationships. Learn more about Toki today.