6 Customer Retention KPIs You Should Track in 2025
Boost your customer loyalty with these 6 key customer retention KPIs. Learn how to track and improve these metrics for sustainable business growth in 2025.
Unlocking Customer Loyalty: The Power of KPIs
Want to build a loyal customer base and boost your bottom line? This listicle reveals six essential customer retention KPIs you need to track in 2025. Learn how monitoring metrics like Customer Retention Rate (CRR), Customer Churn Rate, Net Promoter Score (NPS), Customer Lifetime Value (CLV), Repeat Purchase Rate (RPR), and Customer Health Score can help you identify areas for improvement, optimize your retention strategies, and maximize customer lifetime value. These customer retention KPIs provide the insights you need to cultivate lasting customer relationships and drive repeat business.
1. Customer Retention Rate (CRR)
Customer Retention Rate (CRR) is a crucial customer retention KPI that measures the percentage of customers a business retains over a specific period. It's a fundamental metric for understanding customer loyalty, predicting future revenue, and evaluating the effectiveness of retention strategies. For Shopify and e-commerce merchants, direct-to-consumer startups, retail brands, and subscription-based businesses, CRR provides invaluable insights into the health and sustainability of their customer base. Including CRR in your suite of customer retention KPIs is essential for data-driven decision-making and long-term growth.
Calculating CRR is straightforward:
CRR = [(Customers at End of Period - New Customers Acquired) / Customers at Start of Period] × 100
This formula essentially subtracts the newly acquired customers during the period from the total customers at the end, ensuring that the metric reflects only retained existing customers. This result is then divided by the initial customer count and multiplied by 100 to express it as a percentage. A higher CRR indicates better customer retention, signifying stronger customer loyalty and a more stable revenue stream.
This metric offers several advantages:
- Measures customer loyalty over time: CRR provides a clear picture of how well a business is retaining its existing customer base.
- Easy to calculate and understand: The formula is simple and the resulting percentage is readily interpretable.
- Provides a baseline for other retention metrics: CRR serves as a foundation upon which other, more complex retention metrics can be built.
- Can be segmented: Analyzing CRR by customer demographics, product lines, acquisition channels, or other segments allows businesses to identify areas of strength and weakness in their retention efforts.
While CRR is a valuable metric, it's important to be aware of its limitations:
- Doesn't explain why customers leave: While CRR highlights retention issues, it doesn't provide insights into the reasons behind customer churn.
- May not account for varying customer values: CRR treats all customers equally, regardless of their individual purchase frequency or revenue contribution.
- Can be misleading if customer acquisition is very high: A rapidly expanding customer base can artificially inflate CRR, masking potential retention problems.
- Backward-looking metric: CRR reflects past performance and doesn't necessarily predict future retention.
Successful businesses across various industries prioritize and track CRR. Netflix, for example, boasts a high monthly retention rate, around 93%, showcasing its ability to keep subscribers engaged with its content library. Amazon Prime also demonstrates impressive retention with annual rates nearing 98%, highlighting the value proposition of its membership program. SaaS companies like Salesforce often target annual retention rates of 90% or higher, understanding that retaining existing customers is crucial for sustainable growth in a subscription-based model.
The following infographic visualizes a simplified CRR calculation:
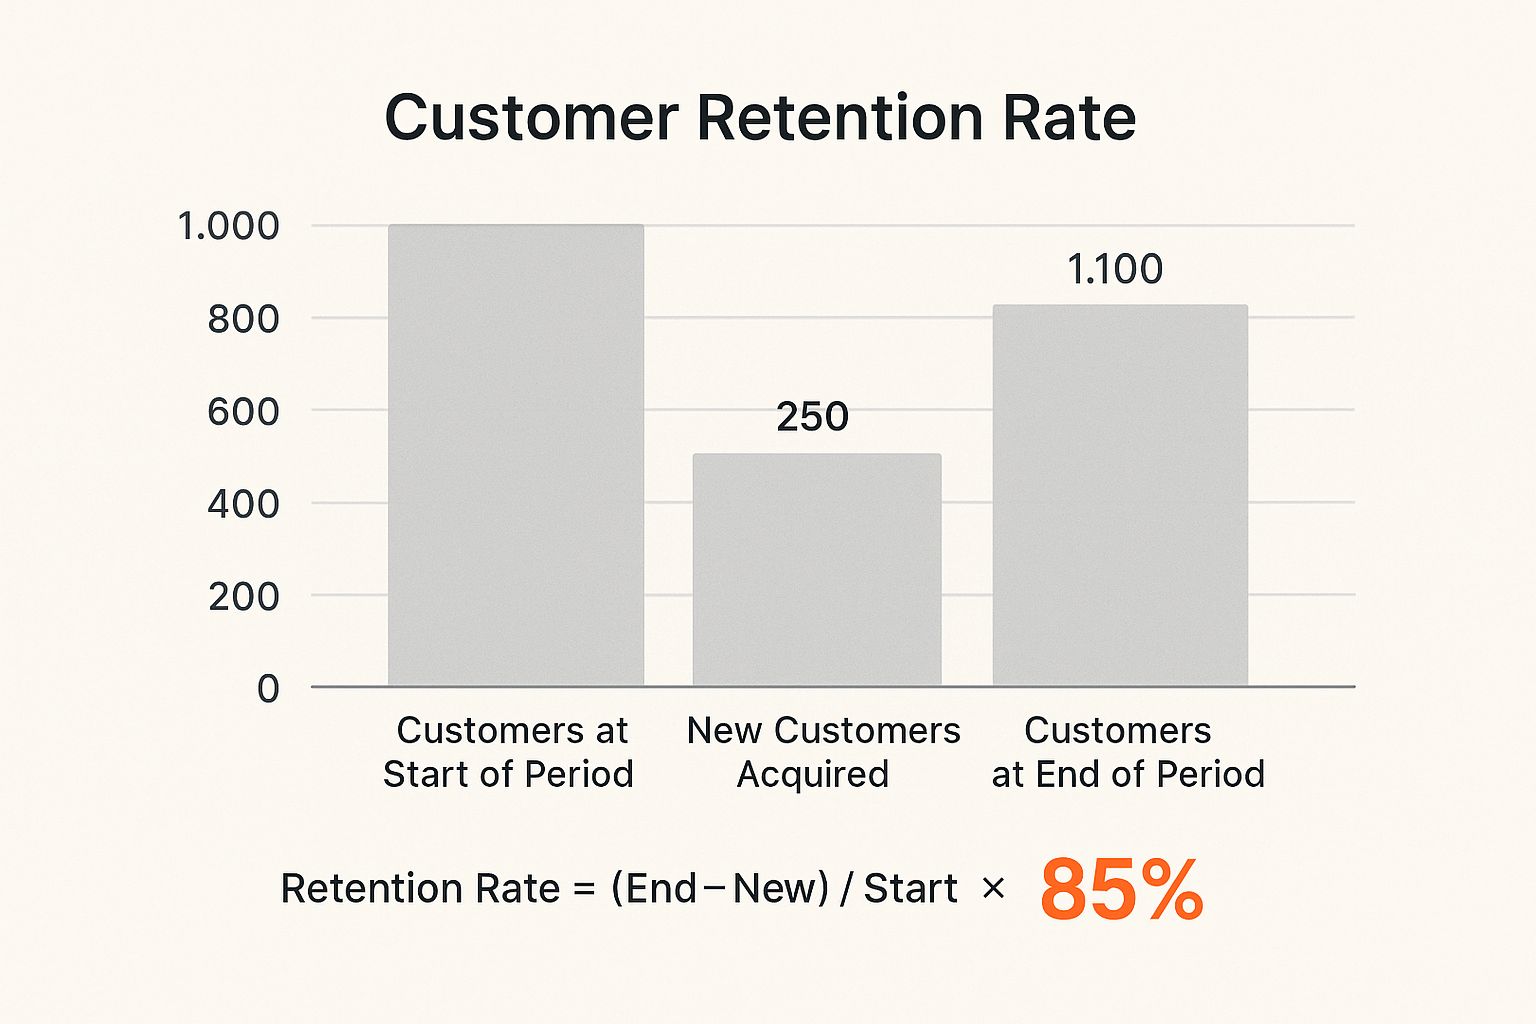
This bar chart shows the customer count at the start and end of a period, along with the number of new customers acquired. As the chart demonstrates, starting with 1000 customers, acquiring 250 new customers, and ending the period with 1100 customers results in an 85% retention rate.
To effectively utilize CRR, consider these tips:
- Track regularly: Monitor CRR on a monthly, quarterly, and annual basis to identify trends and patterns.
- Segment your data: Break down CRR by customer segments and acquisition channels to pinpoint areas for improvement.
- Benchmark against industry standards: Compare your CRR to competitors and industry averages to assess your performance.
- Combine with qualitative feedback: Supplement CRR data with customer surveys and feedback to understand the why behind your retention numbers.
By understanding and actively monitoring CRR, businesses can gain valuable insights into customer loyalty, identify areas for improvement in their retention strategies, and ultimately drive sustainable growth. Combining this quantitative data with qualitative feedback will provide a comprehensive understanding of your customers' journey and empower you to optimize their experience, fostering long-term loyalty and increasing customer lifetime value.
2. Customer Churn Rate
Customer Churn Rate is a crucial customer retention KPI that measures the percentage of customers who discontinue using a company's products or services within a specific timeframe. Understanding and monitoring this metric is essential for any business, especially for Shopify and e-commerce merchants, direct-to-consumer startups, retail brands, and subscription-based businesses, as it directly impacts revenue and growth. A high churn rate signifies a leaky bucket, where acquired customers are lost almost as quickly as they are gained. This makes it harder to scale and achieve sustainable profitability. Therefore, churn rate deserves a prominent place in any list of essential customer retention KPIs. It acts as a critical barometer of customer satisfaction and loyalty, highlighting areas where improvements are needed to strengthen customer relationships.
Calculating churn rate is straightforward: (Customers Lost During Period / Total Customers at Start of Period) × 100. This formula provides a percentage that represents the proportion of your customer base that has churned. It's the inverse of retention rate; a high retention rate implies a low churn rate, and vice versa. For example, if you started the month with 1000 customers and lost 50, your churn rate is (50/1000) * 100 = 5%.
This metric is highly versatile as it can be measured across different time periods (monthly, quarterly, annually) providing insights into short-term and long-term trends. Moreover, it can be segmented by various customer characteristics, like demographics, purchase history, or subscription tier, allowing businesses to pinpoint specific cohorts experiencing higher churn. This granularity is invaluable for targeted retention strategies.
Features of Churn Rate as a KPI:
- Inverse relationship with retention rate: As mentioned, churn and retention are two sides of the same coin. Improving one naturally impacts the other.
- Voluntary vs. Involuntary Churn: Churn can be categorized as voluntary, where the customer actively chooses to leave, or involuntary, such as failed payments or expired credit cards. Distinguishing between these types is essential for effective intervention strategies.
- Measurable across different time periods: Flexibility in measurement allows for both short-term performance monitoring and long-term trend analysis.
- Segmentable by customer characteristics: This allows businesses to identify at-risk customer segments and tailor retention efforts accordingly.
Pros of Monitoring Churn Rate:
- Highlights immediate business risks: A rising churn rate is a clear signal of potential revenue loss and customer dissatisfaction.
- Helps prioritize retention efforts: By understanding which customer segments are churning and why, businesses can focus their resources on the most impactful areas.
- Easy to communicate to stakeholders: Churn rate is a readily understandable metric that can effectively convey the importance of customer retention.
- Enables proactive intervention strategies: Monitoring churn allows for timely intervention, such as win-back campaigns or targeted customer support, to prevent further losses.
Cons of Relying Solely on Churn Rate:
- Reactive rather than predictive: While churn rate highlights current issues, it doesn't necessarily predict future churn.
- Doesn't indicate customer lifetime value impact: Losing high-value customers has a more significant impact than losing low-value ones, and churn rate alone doesn't capture this nuance.
- May not distinguish between different churn reasons: A deeper dive into the why behind churn is necessary to address the root causes. Learn more about Customer Churn Rate
- Can create negative focus rather than positive retention: An overemphasis on reducing churn can overshadow the importance of building positive customer relationships and proactive retention strategies.
Examples of Churn Rate Benchmarks:
- Spotify: Maintains a monthly churn rate below 5%, demonstrating high customer loyalty in a competitive market.
- Traditional telecom companies: Average 1.5-2% monthly churn, reflecting the nature of subscription-based services with contractual obligations.
- B2B SaaS companies: Typically see 5-10% annual churn, varying based on industry, pricing, and customer acquisition strategies.
Actionable Tips for Utilizing Churn Rate:
- Identify early warning signs before churn occurs: Track customer engagement metrics like website activity, purchase frequency, and customer service interactions to identify potential churners before they leave.
- Analyze churn by customer segments: Dive deeper than the overall churn rate. Segmenting by demographics, purchase behavior, or product usage can reveal valuable insights into specific churn drivers.
- Implement win-back campaigns for recent churners: Targeted emails, discounts, or exclusive offers can entice recent churners to return.
- Track both voluntary and involuntary churn separately: Addressing involuntary churn, like failed payments, requires different strategies than tackling voluntary churn due to dissatisfaction.
By actively monitoring and analyzing customer churn rate, businesses can gain crucial insights into customer behavior, identify areas for improvement, and implement effective strategies to build a loyal and profitable customer base. This is particularly important for businesses operating in competitive landscapes like Shopify and e-commerce, where customer retention is a key driver of sustainable growth.
3. Net Promoter Score (NPS)
Net Promoter Score (NPS) is a widely recognized customer retention KPI that gauges customer loyalty and satisfaction. It operates on a simple premise: asking your customers how likely they are to recommend your company, product, or service to others. This "likelihood to recommend" question is presented on a scale of 0 to 10, where 0 represents "Not at all likely" and 10 signifies "Extremely likely." Based on their responses, customers are categorized into three groups: Promoters (9-10), Passives (7-8), and Detractors (0-6). NPS is then calculated by subtracting the percentage of Detractors from the percentage of Promoters, resulting in a score that can range from -100 to +100. This single metric serves as a powerful predictor of customer retention, organic growth, and overall business health.

NPS deserves its place on this list because it provides a concise and easily understandable measure of customer sentiment. It’s a valuable tool for Shopify and e-commerce merchants, direct-to-consumer startups, retail brands, and subscription-based businesses aiming to understand customer loyalty and predict future growth. Its standardized scoring system allows for benchmarking against competitors and across industries, offering valuable context for performance evaluation. For marketing and growth professionals, NPS can inform strategies focused on gamification and referral programs by identifying enthusiastic promoters.
Here's a breakdown of its key features, advantages, and disadvantages:
Features:
- Single question survey methodology: The simplicity of a single question makes it easy for customers to respond and reduces survey fatigue.
- Standardized scoring system: The 0-10 scale and the calculation method provide a consistent framework for measuring and comparing NPS across different businesses and industries.
- Predictive of customer behavior: NPS has been shown to correlate with customer retention, repeat purchase rates, and overall business growth.
- Benchmarkable across industries: Publicly available NPS data allows businesses to compare their performance against competitors and identify areas for improvement.
Pros:
- Simple to implement and understand: Implementing NPS surveys is straightforward, and the score is easy to interpret.
- Strong correlation with business growth: A higher NPS generally indicates stronger customer loyalty, which often translates into increased revenue and profitability.
- Widely recognized benchmark: The widespread adoption of NPS allows businesses to benchmark their performance against industry averages and best-in-class companies.
- Actionable insights for improvement: By analyzing the feedback provided by Promoters, Passives, and Detractors, businesses can identify specific areas for improvement.
Cons:
- Cultural bias in scoring: Cultural differences can influence how customers respond to the NPS question, potentially impacting the accuracy of the score.
- Limited diagnostic information: While NPS provides a high-level overview of customer sentiment, it doesn't always provide detailed insights into the specific drivers of satisfaction or dissatisfaction.
- May not reflect actual behavior: While NPS intends to predict behavior, a high score doesn't always guarantee that customers will actually recommend the company.
- Requires consistent follow-up for insights: To gain actionable insights, businesses need to follow up with respondents and understand the reasons behind their scores.
Examples of Successful Implementation:
- Apple: Consistently scores an NPS of 70+, demonstrating strong customer loyalty and brand advocacy.
- Tesla: Maintains an exceptionally high NPS above 90, reflecting a highly satisfied and engaged customer base.
- Amazon: Averages an NPS between 50-60 across its various services, showcasing its focus on customer experience despite the complexities of a diverse service portfolio.
Tips for Effective NPS Utilization:
- Follow up with open-ended questions: Ask "Why?" after the initial NPS question to understand the reasoning behind the score and gain deeper insights.
- Track trends over time rather than absolute scores: Focus on the trajectory of your NPS over time to assess the effectiveness of your customer retention initiatives.
- Segment NPS by customer journey stages: Analyze NPS scores at different stages of the customer journey (e.g., onboarding, post-purchase, etc.) to identify specific areas for improvement.
- Close the loop with respondents: Respond to both positive and negative feedback to show customers that their opinions are valued and to address any concerns.
By understanding and leveraging the power of NPS, businesses can gain valuable insights into customer loyalty, identify areas for improvement, and ultimately drive sustainable growth. For businesses ranging from Shopify merchants to established retail brands, NPS provides a critical tool for measuring and improving the customer experience. The insights derived from NPS can be further utilized to strengthen retention efforts, optimize marketing strategies, and ultimately cultivate a loyal customer base.
4. Customer Lifetime Value (CLV)
Customer Lifetime Value (CLV) is a crucial customer retention KPI that represents the total revenue a business can realistically expect from a single customer account throughout their entire relationship. Understanding CLV is fundamental for making informed decisions about sales, marketing, product development, and customer support. It provides a forward-looking perspective on customer relationships, moving beyond individual transactions to assess the long-term value each customer brings. By focusing on CLV, businesses can optimize their strategies to maximize profitability and build sustainable growth. This metric helps companies understand how much they should invest in acquiring and retaining customers, making it a vital component of any successful customer retention strategy.

CLV is calculated using key factors like average purchase value, purchase frequency, and customer lifespan. For example, a customer who consistently makes large purchases every month for several years will have a significantly higher CLV than a customer who makes a single small purchase and never returns. This is why CLV is such a powerful metric for customer retention – it encourages businesses to focus on building long-term relationships with their most valuable customers. It’s not just about acquiring new customers; it's about nurturing existing ones and encouraging repeat business. This is especially relevant for Shopify and e-commerce merchants, direct-to-consumer startups, and retail brands looking to build customer loyalty and unify their retention efforts.
One of the most significant benefits of using CLV as a customer retention KPI is its ability to guide customer acquisition spending. By understanding the potential long-term value of a customer, businesses can determine how much they can afford to invest in acquiring them. This helps prevent overspending on acquisition and ensures that marketing efforts are focused on attracting high-value customers. For example, if a company knows that their average CLV is $500, they can justify spending more on acquiring a customer than if their average CLV was only $50. This knowledge allows businesses to optimize their marketing budgets and allocate resources effectively.
CLV also helps prioritize high-value customers. By identifying customers with high CLV, businesses can tailor their services and marketing efforts to cater to their specific needs and preferences. This personalized approach fosters stronger relationships and encourages repeat business. This is particularly beneficial for subscription-based businesses interested in tiered paid membership models, allowing them to tailor premium offerings to their most valuable subscribers.
Furthermore, CLV informs product development decisions. By understanding what high-CLV customers value most, businesses can develop products and services that meet their specific needs and preferences. This customer-centric approach can lead to increased customer satisfaction and loyalty, driving even higher CLV.
However, CLV isn't without its limitations. Calculating CLV accurately can be complex, requiring historical data and often involving assumptions about future customer behavior. Rapid business changes, market fluctuations, and evolving customer preferences can also impact CLV, making it essential to update calculations regularly. Moreover, an overemphasis on CLV can sometimes overshadow the importance of short-term revenue generation and immediate customer satisfaction. Despite these challenges, the insights gained from CLV far outweigh the complexities, making it an invaluable tool for businesses seeking to maximize customer retention.
Successful implementation of CLV can be seen in companies like Starbucks, where the average CLV is estimated at $14,099 per customer, and Amazon, where Prime members have a CLV twice as high as non-Prime members. Even companies with high initial purchase costs, such as Tesla, see the benefit of focusing on CLV, with their estimated CLV exceeding $100,000 when factoring in service and accessories. These examples demonstrate the power of CLV across different industries and business models.
To effectively utilize CLV, it’s recommended to use multiple calculation methods for validation, segment CLV by customer acquisition channel to understand which channels are most effective at attracting high-value customers, and regularly update calculations as the business evolves. Also, don't forget to factor in the referral value from high-CLV customers, as they can be powerful advocates for your brand. Learn more about Customer Lifetime Value (CLV) and how to maximize it for your business. By focusing on CLV as a key customer retention KPI, businesses can make data-driven decisions that foster long-term customer relationships, drive sustainable growth, and ultimately maximize profitability.
5. Repeat Purchase Rate (RPR)
Repeat Purchase Rate (RPR) is a crucial customer retention KPI that measures the percentage of customers who return to make more than one purchase from your business within a specific timeframe. It's a powerful metric that provides direct insight into customer loyalty, product satisfaction, and the overall health of your business. For e-commerce merchants, Shopify store owners, and direct-to-consumer startups, understanding and optimizing RPR is paramount for sustainable growth. Including RPR in your suite of customer retention KPIs is essential because it directly correlates with revenue generation and business longevity. A high RPR indicates a loyal customer base, successful products, and a robust business model, solidifying its importance amongst other retention metrics.
How it Works and Why it Matters
RPR is calculated using a straightforward formula: (Number of Customers Who Purchased More Than Once / Total Number of Customers) × 100. The timeframe you choose for measurement is critical. It should align with your business cycle and customer behavior. For example, a business selling fast-moving consumer goods might use a shorter timeframe (e.g., 30 days) compared to a business selling durable goods (e.g., 1 year).
This metric goes beyond simple transactions; it reflects the strength of your customer relationships. A high RPR suggests that customers are satisfied with their initial purchase and find enough value to return for more. This behavioral loyalty translates to consistent revenue streams, reduced customer acquisition costs, and stronger brand advocacy through word-of-mouth referrals.
Examples of Successful Implementation
Industry giants like Amazon boast remarkably high repeat purchase rates, often exceeding 90%. This success stems from a combination of factors, including personalized recommendations, seamless customer service, and a vast product selection. Similarly, beauty retailer Sephora achieves high RPRs (around 80%) by cultivating a strong community, offering exclusive rewards programs, and providing personalized beauty consultations. While these are examples of large corporations, even a typical e-commerce business can aim for a healthy RPR in the 20-30% range, demonstrating the applicability of this metric across various business scales.
Actionable Tips for Optimizing RPR
- Track RPR Across Different Time Windows: Analyzing RPR over varying periods (e.g., 30 days, 90 days, 1 year) provides a more comprehensive understanding of customer purchase patterns. This allows you to identify trends and tailor retention strategies accordingly.
- Segment by Product Categories: Examining RPR for specific product categories reveals which products are driving repeat purchases and which might need improvement or different marketing strategies. This is particularly useful for Shopify merchants with diverse product offerings.
- Combine with Purchase Frequency Analysis: Pairing RPR with purchase frequency data provides a richer understanding of customer behavior. You can identify your most loyal customers (high RPR and high purchase frequency) and target them with exclusive offers or loyalty programs.
- Use to Optimize Customer Onboarding: A well-structured onboarding process can significantly impact RPR. Provide personalized recommendations, educational content, and incentives for first-time buyers to encourage repeat purchases. For subscription-based businesses, tiered paid membership models can be an effective way to incentivize higher spending and increase RPR.
- Leverage Gamification and Referrals: Implement loyalty programs with gamified elements, such as points, badges, and tiered rewards, to encourage repeat purchases. Referral programs can also boost RPR by incentivizing existing customers to bring in new ones.
Pros and Cons of Using RPR
Pros:
- Simple to calculate and track
- Directly relates to revenue growth
- Helps identify successful products
- Useful for inventory and demand planning
Cons:
- Doesn't account for purchase timing variations
- May not reflect true customer value (high-value customers might purchase less frequently)
- Industry and business model dependent
- Limited insight into customer motivations
When and Why to Use RPR
RPR is a valuable metric for any business that relies on repeat customers, especially e-commerce, retail brands, and subscription-based businesses. It should be used regularly to monitor customer loyalty, assess the effectiveness of retention strategies, and inform business decisions related to product development, marketing, and customer service. By focusing on increasing RPR, businesses can build a sustainable growth model based on loyal customer relationships, leading to enhanced profitability and long-term success. For retail brands seeking to unify online and brick-and-mortar loyalty initiatives, RPR provides a consistent metric to track and optimize retention efforts across all channels. Similarly, for marketing and growth professionals aiming to enhance retention, RPR offers a quantifiable measure of success for initiatives like gamification and referral programs.
6. Customer Health Score
Customer Health Score is a crucial customer retention KPI for any business, especially for Shopify and e-commerce merchants, direct-to-consumer startups, retail brands, and subscription-based businesses focused on building lasting customer relationships. It's a powerful tool for identifying at-risk customers before they churn and highlighting opportunities to strengthen relationships with high-value customers. By understanding and effectively utilizing this metric, businesses can proactively improve customer retention and boost overall growth. This makes it a deserved addition to any list of essential customer retention KPIs.
In essence, a Customer Health Score is a composite metric that combines multiple data points into a single, easily digestible score reflecting the overall health of the customer relationship. Think of it as a vital sign for your customers. Instead of relying on reactive measures like analyzing churn after it happens, the health score provides a predictive lens, allowing businesses to anticipate potential issues and intervene proactively.
This score is typically derived from a combination of factors, including:
- Product Usage: How frequently and deeply is the customer using your product or service?
- Engagement Levels: Are they interacting with your emails, social media posts, or other content?
- Support Interactions: Have they contacted customer support, and what was the nature of those interactions (positive or negative)?
- Satisfaction Scores: What feedback have they provided through surveys or other channels?
The power of the Customer Health Score lies in its ability to combine these disparate data points into a single, actionable metric. This composite scoring system transforms raw data into meaningful insights, providing a clear picture of each customer's likelihood of staying or leaving.
Features and Benefits of Utilizing a Customer Health Score:
- Predictive, not Reactive: Anticipate churn and identify opportunities before they're lost.
- Customizable: Tailor the scoring system to reflect the specific needs and priorities of your business model. Whether you're a subscription-based service or an e-commerce store, you can adjust the weighting of different factors to align with your unique customer journey.
- Real-time Monitoring: Keep a constant pulse on customer health and identify emerging trends. This is particularly valuable for businesses operating in fast-paced environments.
- Early Warning System: Identify at-risk customers and proactively address their concerns.
- Enables Proactive Customer Success: Provide targeted support and resources to customers who need it most. For example, a declining health score might trigger an automated email offering personalized assistance or a dedicated customer success manager outreach.
- Prioritizes Customer Success Efforts: Focus resources on high-value customers and those most likely to churn.
- Supports Automated Workflows: Integrate the health score into your CRM and other systems to automate tasks like sending targeted emails or assigning tasks to customer success teams.
Examples of Successful Implementation:
Several companies have demonstrated the effectiveness of Customer Health Scoring:
- HubSpot: Uses health scores to predict churn up to 90 days in advance, allowing them to proactively engage with at-risk customers.
- Salesforce Einstein: Leverages AI-powered scoring to identify expansion opportunities, helping sales teams target high-potential accounts.
- Zendesk: Combines usage and satisfaction data into health scores to provide a comprehensive view of customer relationships.
Tips for Implementing a Customer Health Score:
- Include Both Behavioral and Sentiment Data: Combine quantitative data (e.g., product usage) with qualitative data (e.g., customer satisfaction surveys) for a more holistic view.
- Weight Factors Based on Business Impact: Assign different weights to each factor based on its influence on customer retention. For instance, for a subscription business, consistent product usage might be weighted more heavily than website visits.
- Set Up Automated Alerts for Score Changes: Receive notifications when a customer's health score drops significantly, allowing for immediate intervention.
- Regularly Validate Scores Against Actual Outcomes: Continuously analyze the accuracy of your health score and make adjustments as needed.
Pros and Cons:
While powerful, Customer Health Scoring has its drawbacks:
- Pros: Early warning system, proactive customer success enablement, prioritized efforts, automated workflow support.
- Cons: Complex design and maintenance, significant data infrastructure requirements, potential oversimplification of customer relationships, need for regular calibration and updates.
Despite the complexity, the benefits of implementing a Customer Health Score significantly outweigh the challenges, particularly for businesses committed to long-term customer retention and growth. Learn more about Customer Health Score to delve deeper into its practical applications. By understanding and effectively leveraging this key metric, businesses can proactively nurture customer relationships, reduce churn, and ultimately drive sustainable success.
6 Key Customer Retention KPIs Comparison
| KPI | 🔄 Implementation Complexity | 🛠️ Resource Requirements | 📊 Expected Outcomes | 💡 Ideal Use Cases | ⭐ Key Advantages |
|---|---|---|---|---|---|
| Customer Retention Rate (CRR) | Low - Simple calculation and tracking | Low - Basic customer data | Medium - Measures customer loyalty; baseline KPI | Subscription services, SaaS, telecom | Easy to calculate; correlates with revenue |
| Customer Churn Rate | Low - Inverse of retention, straightforward | Low - Customer activity records | Medium - Identifies attrition and revenue leakage | SaaS, telecom, subscription, B2B | Highlights immediate risks; aids retention focus |
| Net Promoter Score (NPS) | Low - Simple survey-based | Low to Medium - Survey platform and follow-up | High - Predicts customer loyalty and growth | Customer experience, brand loyalty | Widely recognized; actionable insights |
| Customer Lifetime Value (CLV) | High - Complex calculation, requires modeling | High - Historical data, analytics tools | High - Forecasts customer revenue and ROI | E-commerce, retail, high-value client management | Guides investment; prioritizes high-value customers |
| Repeat Purchase Rate (RPR) | Low - Straightforward ratio | Low - Purchase transaction data | Medium - Indicates behavioral loyalty | Retail, e-commerce | Simple to track; relates directly to revenue growth |
| Customer Health Score | High - Composite, customizable, requires setup | High - Multiple data sources, real-time monitoring | High - Predictive of churn and expansion opportunities | SaaS, customer success, support-driven businesses | Early warning system; proactive retention |
Taking Action: Using Customer Retention KPIs to Drive Growth
Effectively managing customer retention is crucial for sustainable business growth. This article explored six key customer retention KPIs: Customer Retention Rate (CRR), Customer Churn Rate, Net Promoter Score (NPS), Customer Lifetime Value (CLV), Repeat Purchase Rate (RPR), and Customer Health Score. Mastering these metrics provides a comprehensive understanding of your customer base, enabling you to identify areas for improvement, personalize customer experiences, and ultimately, boost your bottom line. Prioritizing customer retention not only reduces acquisition costs but also fosters a loyal community of brand advocates who contribute significantly to long-term success. As you refine your customer retention strategies, remember that a strong team is just as crucial for growth. For a deeper dive into leveraging HR metrics for strategic decision-making, check out this comprehensive guide: Mastering HR Metrics for Strategic Impact in 2025. By analyzing and acting upon these customer retention KPIs, you can transform data into actionable insights, fostering a thriving business built on strong customer relationships.
Ready to take your customer retention efforts to the next level? Toki is an all-in-one loyalty platform that empowers you to track, analyze, and leverage these crucial KPIs to build stronger customer relationships and maximize CLV. Explore Toki today and start cultivating a community of loyal brand advocates.