Unlock Growth with Client Retention Metrics
Unlock e-commerce growth with key client retention metrics. Learn to track, interpret, and improve KPIs like CLV and churn to boost loyalty and profit.
So, what exactly are client retention metrics? Think of them as the vital signs for your e-commerce brand's health. They’re the key performance indicators (KPIs) that tell you how good you are at keeping customers coming back. Instead of just chasing new sales, these numbers give you a real, honest look at the strength of your customer relationships and your potential for long-term growth.
Why Retention Metrics Are Your Growth Engine
It’s easy for e-commerce brands to get caught up in the acquisition game, pouring endless budgets into ads to attract new faces. While bringing in new people is obviously important, focusing only on that is like trying to fill a leaky bucket. The real secret to building a sustainable business isn't just getting more water; it's plugging the holes.
This is where client retention metrics become your best friend. They turn a vague idea like "customer loyalty" into hard, actionable data. These metrics are the essential dials and gauges on your business dashboard, giving you a clear picture of what’s working and helping you make much smarter decisions.
From Data Points to Strategic Levers
Once you start understanding your retention numbers, you can shift from just reacting to problems to proactively planning for growth. Watching these key figures helps you:
- Predict Future Revenue: A steady retention rate makes your income more predictable, which takes a ton of guesswork out of financial planning.
- Optimize Your Marketing Spend: When you know what a loyal customer is truly worth, you can confidently invest in relationship-building programs instead of just chasing one-off clicks.
- Build a Resilient Brand: Loyal customers are your buffer. They stick with you through market changes and competitor promotions, creating a solid foundation for your brand.
The financial upside of focusing on retention is staggering. Research has consistently shown that a mere 5% increase in customer retention can boost profits by 25% to 95%. That’s incredible leverage. If you're curious, you can dig into more of these powerful retention statistics to see the full impact.
In essence, client retention metrics shift your focus from short-term transactions to long-term relationships. They are not just numbers to report; they are the blueprint for building a profitable and enduring e-commerce brand that customers love and return to again and again.
Understanding the Three Core Retention Metrics
If you want to know how healthy your business really is, you have to look past the daily sales numbers. The world of client retention metrics can feel a bit overwhelming at first, but it really just boils down to answering three simple questions. Think of them as your store's vital signs—each one gives you a clear snapshot of its condition.
Let's break down this essential trio by connecting each metric to a straightforward question. This cuts through the jargon and gets right to what you need to know to build a stronger, more profitable business.
Customer Retention Rate (CRR): Are My Customers Sticking Around?
Your Customer Retention Rate (CRR) is the most direct measure of loyalty you have. It simply shows you the percentage of customers who stick with you over a certain period. When your CRR is high, it's a huge thumbs-up that your products, customer service, and overall brand experience are hitting the mark.
Let's say you run a monthly coffee subscription box. You start the month with 1,000 subscribers. At the end of the month, 900 of them are still active. Simple math tells you your retention rate is a very solid 90%. That number is proof that your efforts to keep customers happy are working. It’s the ultimate validation that people who buy from you once are happy to do it again.
Customer Lifetime Value (CLV): How Much Is a Customer Worth?
Next up is Customer Lifetime Value (CLV). This metric is all about shifting your focus from one-off sales to the entire long-term relationship. It predicts the total amount of money you can expect from a single customer over their entire time with your brand. Figuring this out helps you make much smarter decisions on everything from marketing budgets to customer service investments.
Back to our coffee subscription. If your average subscriber sticks around for 12 months and pays $30 a month, their CLV is $360. Knowing this, you can confidently spend more to acquire a new customer or to go the extra mile for an existing one, because you see their true long-term financial impact. It reframes customers from mere transactions into valuable, long-term assets.
Your client retention metrics tell a story in three parts. CRR tells you if customers stay, Churn Rate tells you how fast they leave, and CLV tells you what they're worth while they’re with you. Together, they paint a complete picture of customer loyalty.
Churn Rate: How Fast Am I Losing Customers?
Finally, we have Churn Rate, which is the other side of the retention coin. It measures the percentage of customers who stop buying from you during a specific timeframe. Think of it as the "leaky bucket" indicator—it shows you just how quickly you're losing the customers you worked so hard to get in the first place.
If our coffee box with 1,000 subscribers loses 100 of them in one month, the churn rate is 10%. A churn rate that's starting to creep up is a red flag. It could be pointing to problems with product quality, frustrating shipping delays, or lackluster support. Watching this number closely lets you spot trouble early and fix it before it snowballs.
To help you keep these straight, here's a quick cheat sheet.
Your Client Retention Metrics Cheat Sheet
This table breaks down each core metric, the key question it answers, and why it's so critical for your e-commerce store's success.
| Metric Name | The Question It Answers | Why It Matters for Your Business |
|---|---|---|
| Customer Retention Rate (CRR) | Are my existing customers staying with me? | Shows if your product and experience are creating loyal, repeat buyers. It's the ultimate measure of satisfaction. |
| Customer Lifetime Value (CLV) | How much revenue can I expect from an average customer? | Informs how much you can afford to spend on acquiring new customers and delighting existing ones. |
| Churn Rate | How quickly are customers leaving my brand? | Acts as an early warning system for problems with your products, pricing, or customer service. |
Think of this as your dashboard for customer loyalty. Each metric gives you a different lens to view the health of your customer base.
For a deeper dive into these core metrics and other valuable indicators, check out our complete guide to customer retention KPIs. Getting a handle on these foundational concepts is the first step toward building a data-driven retention strategy that fuels real, sustainable growth.
How to Calculate Your Retention Metrics
Knowing the theory behind client retention metrics is one thing, but plugging in your own numbers is where the magic really happens. Moving from concepts to calculations can feel a bit daunting, but I promise it's more straightforward than you might think. Let's walk through exactly how to measure the three most important metrics for your e-commerce store.
This infographic gives you a quick visual of what we're about to break down. Each metric tells a slightly different story about your relationship with your customers.
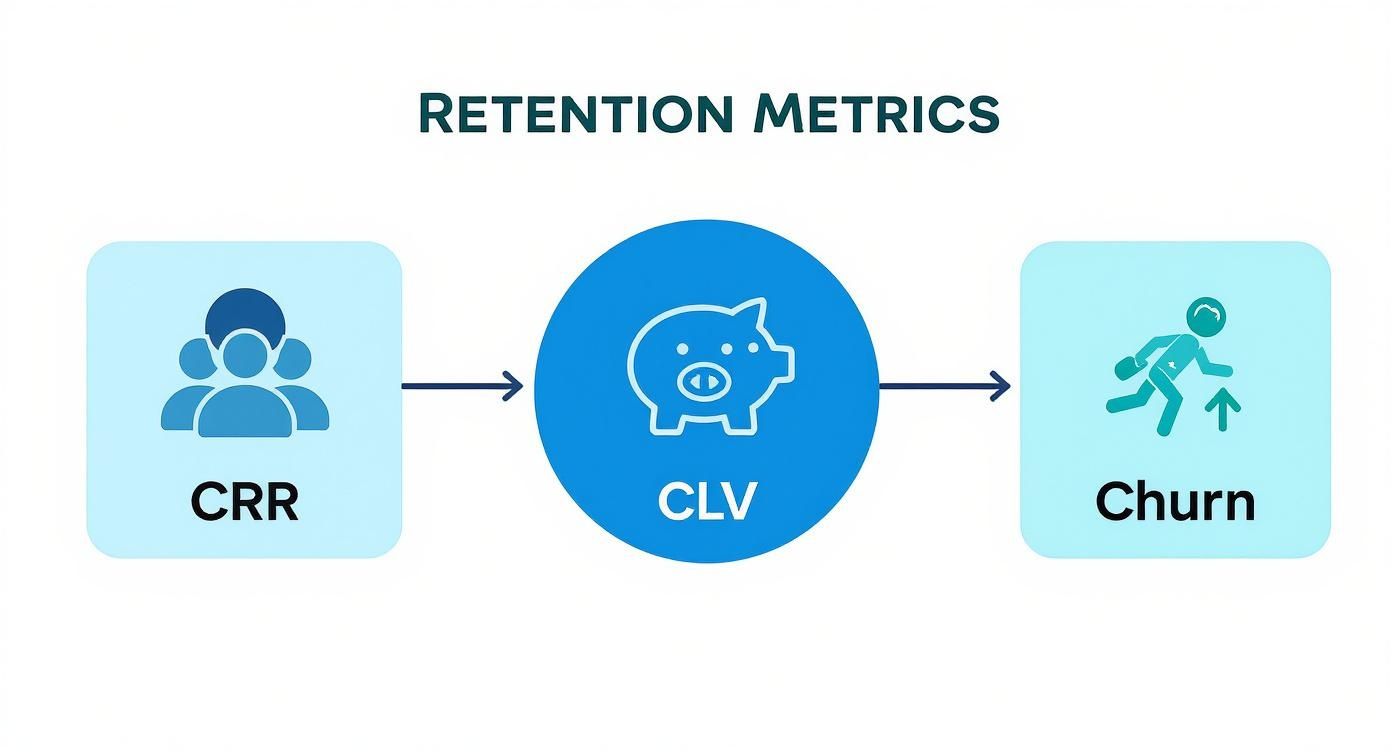
As you can see, CRR, CLV, and Churn all work together. They paint a complete picture of how good you are at not just attracting customers, but keeping them happy and coming back for more.
Calculating Customer Retention Rate (CRR)
Your Customer Retention Rate (CRR) is the big one. It tells you, in simple terms, what percentage of your customers stuck around over a certain period. Think of it as your loyalty score.
To get this number, you just need to pull three figures from your e-commerce platform:
- S: The number of customers you had at the start of the period (e.g., the first day of the month).
- E: The number of customers you had at the end of the period.
- N: The number of new customers you brought in during that time.
The formula is pretty simple:
CRR = [ ( E - N ) / S ] x 100
Let's See It in Action: Imagine your online store kicked off January with 5,000 customers (S). By the end of the month, your total customer count was 5,400 (E), and you’d acquired 600 brand-new shoppers (N).
- CRR = [ ( 5,400 - 600 ) / 5,000 ] x 100
- CRR = [ 4,800 / 5,000 ] x 100
- CRR = 96%
A 96% CRR for the month is fantastic! It means you held onto the vast majority of your existing customer base, which is a huge sign you're doing things right. If you want to dive deeper, you can learn more about the nuances of the customer retention rate calculation formula.
Figuring Out Your Churn Rate
Churn Rate is the flip side of retention. It’s the percentage of customers you lost. This metric is your smoke detector—it alerts you to problems before they turn into a fire.
The math here is even easier. You just need two numbers:
- Customers Lost: Anyone who didn't buy again or cancelled their subscription during the period.
- Customers at Start: The total number of customers you had at the beginning.
Here's the formula:
Churn Rate = ( Customers Lost / Customers at Start ) x 100
Putting It to the Test: Let's say you started the quarter with those same 5,000 customers, but 200 of them didn't come back.
- Churn Rate = ( 200 / 5,000 ) x 100
- Churn Rate = 4%
Seeing a 4% quarterly churn rate is your cue to start digging. Why did those 200 people leave? What can you do to prevent the next 200 from walking away?
Estimating Customer Lifetime Value (CLV)
Customer Lifetime Value (CLV) is a powerful forecast. It predicts how much revenue a single customer is likely to generate for your business over their entire relationship with you. There are some incredibly complex ways to calculate this, but a simple, back-of-the-napkin formula is a great place to start.
You'll need these three averages:
- Average Purchase Value (APV): How much does a customer typically spend in one order?
- Average Purchase Frequency (APF): How many times do they buy from you in a given period (like a year)?
- Average Customer Lifespan: How long, on average, does a customer stick with your brand?
You then multiply them together:
CLV = APV x APF x Average Customer Lifespan
These core principles of tracking and measuring engagement are universal. You can see a similar approach applied in a different context when you learn how to boost your Instagram interaction rate. Getting comfortable with these calculations is the first real step toward building a smarter, data-driven strategy that turns first-time buyers into lifelong fans.
Turning Your Metrics into Actionable Insights
Getting your numbers is just the starting line. A number by itself—a retention rate, a CLV—is meaningless without context. The real magic happens when you translate these figures into a story about your business.
Sure, a 95% retention rate looks fantastic on paper. But what if your closest competitor is sitting at 98%? All of a sudden, your "great" number highlights a potential weakness. Context is king.
Think of it this way: a single data point is like one frame of a movie. Tracking trends over time is what lets you see the whole film. Is your Customer Lifetime Value (CLV) climbing month after month? That's a great sign your loyalty programs and product improvements are hitting the mark.
But what if your churn rate is creeping up? A small jump from 2% to 3% might not seem like much, but it could be the first warning sign of a problem with your post-purchase experience, a new competitor stealing market share, or a shift in what customers want. Catching these trends early is how you fix a small leak before it becomes a flood.
How Do You Stack Up? Benchmarking Your Performance
Knowing where you stand in the larger picture is vital. A "good" retention rate isn't a one-size-fits-all number; it changes dramatically based on what you sell. A coffee subscription brand with small, frequent purchases will have a completely different retention reality than a store selling high-end furniture.
Recent data paints a clear picture of these differences. Media and professional services often see retention rates around 84%, while industries like hospitality and restaurants are closer to 55%. Financial services typically fall in the 75-78% range.
Your goal isn't to chase some universal "perfect" number. It's to understand what's realistic and achievable for your business model and in your market. Use benchmarks as a compass, not a rigid report card.
Digging Deeper with Trend and Segment Analysis
To get insights that truly move the needle, you have to look past the top-line numbers and start slicing your data. This is where you can ask the questions that lead to real breakthroughs:
- Which customer segments have the highest lifetime value?
- Do customers who come from Instagram ads churn faster than those from our email list?
- Are people who buy Product X more likely to come back for another purchase?
Answering questions like these means grouping your customers into segments based on shared behaviors or characteristics. For a masterclass on this technique, check out our guide on what is cohort analysis.
This kind of analytical thinking is the key to improving every part of your business. While we're focused on retention here, applying the same rigor to other areas, like measuring SEO ROI, can unlock growth across the board.
By constantly tracking, segmenting, and questioning your data, you stop reacting to numbers and start using them to build a strategic roadmap for a stronger, more profitable brand.
Actionable Strategies to Improve Retention

Knowing your client retention metrics is one thing; actually improving them is another. The numbers tell you what's happening, but these strategies are about how to change the story. By linking specific tactics to the metrics you want to move, you can stop guessing and start building a plan that turns one-time buyers into lifelong fans.
Boosting retention isn’t about some massive, complicated overhaul. It’s usually about nailing the small moments—those little touchpoints in the customer journey that make someone feel truly valued. Let's dig into some proven strategies that directly impact your retention rates and keep churn in check.
Boost CRR and Reduce Churn
To get customers to stick around, you need to give them an experience they won't forget. This goes way beyond the "buy" button and extends into the post-purchase phase, where loyalty is truly won or lost.
A fantastic place to start is with the unboxing experience. This is your first real-world handshake with your customer. Brands like Glossier have this down to an art, using signature packaging, fun samples, and personal touches that make opening a box feel like unwrapping a gift. That small moment of delight creates a powerful emotional connection.
Another workhorse for retention is a solid loyalty program. Give customers a real reason to shop with you again instead of a competitor.
- Offer points for every purchase.
- Reward them for social media follows or reviews.
- Provide exclusive early access to sales or new products.
It turns shopping into a rewarding game and makes your best customers feel like the VIPs they are.
Increase Customer Lifetime Value
Getting more value from each customer means encouraging them to buy more often and spend more when they do. This isn't about being pushy; it's about anticipating their needs and making their shopping experience better.
Smart upselling and cross-selling are your best friends here. If a customer adds a new camera to their cart, it’s the perfect time to suggest a compatible lens or a protective case. Amazon is the undisputed king of this with its "Frequently bought together" section, which not only boosts the average order value but also helps shoppers discover more of what you offer.
Just as important is building a strong customer feedback loop. Don't just ask for reviews; actively listen to what people are saying and—this is the critical part—act on it. When customers see their feedback lead to real changes, they feel like they have a stake in your brand's success. That sense of partnership is incredibly sticky.
Ultimately, a superior customer experience is the bedrock of any successful retention strategy. It’s the common thread that runs through every tactic, from personalized emails to loyalty rewards.
The link between experience and loyalty is crystal clear. Recent studies show that an incredible 99% of consumers say customer experience (CX) is a key factor in their purchasing decisions. The risk of getting it wrong is huge, too—70% of customers will walk away after just two bad experiences. You can dive deeper into the data behind this connection in these customer experience trends for 2025.
Every one of these strategies—from a delightful unboxing to simply listening—is designed to improve your client retention metrics by making your customers feel seen, understood, and appreciated.
Got Questions? Let's Talk Retention Metrics
Once you start digging into client retention metrics, you're bound to have a few questions. That's a good thing. It means you're thinking critically about what the numbers are really telling you about your business.
We've covered the what, how, and why of these metrics. Now, let's tackle some of the most common head-scratchers so you can put this data to work with total confidence.
How Often Should I Actually Check These Numbers?
This isn't a one-size-fits-all answer—it really hinges on your sales cycle. If you're running an e-commerce store where people buy often, like a coffee subscription or a skincare brand, you'll want to be looking at your metrics monthly. This rhythm helps you catch dips or spikes early enough to do something about them.
But what if you sell high-end furniture or custom-built PCs? Your customers might only buy every few years. In that case, checking in monthly will just give you noise. A quarterly review makes much more sense, giving you a clearer picture of long-term trends. The key is to pick a cadence that matches your customers' buying habits and stick with it.
Isn't Retention Just Another Word for Loyalty?
Great question. People use these terms interchangeably all the time, but they're not the same. It helps to think of one as a behavior and the other as an attitude.
Retention is what they do; loyalty is how they feel. Retention is the simple act of a customer coming back to buy again. Loyalty is the why—the emotional connection and trust that makes them choose you over everyone else, every single time.
A customer might stick around (retention) because you’re the cheapest or most convenient option. But a loyal customer stays even when a competitor offers a 10% discount. They’ll also tell their friends about you and be the first in line for your next product launch. You measure retention, but your real goal is to build loyalty.
What Tools Can I Use to Track All This?
You're right to ask—nobody has time to crunch these numbers in a spreadsheet forever. Thankfully, there are some great platforms out there that can automate the heavy lifting and give you much richer insights.
- Your E-commerce Platform: A great starting point is right under your nose. Platforms like Shopify and BigCommerce have built-in analytics dashboards that can give you a solid overview of your CRR and CLV without any extra setup.
- Specialized Analytics Tools: When you're ready to go deeper, tools like Glew, Baremetrics, or ChartMogul are game-changers. They are built specifically for subscription and e-commerce analytics, helping you see things like cohort performance and detailed customer segments.
Using a dedicated tool saves a ton of time and, more importantly, helps you spot the story behind the data. Instead of just seeing numbers, you'll see patterns that can inform your entire marketing strategy.
Ready to turn these insights into action? Toki provides a complete suite of loyalty, referral, and membership tools designed to boost your retention metrics and build a thriving community around your brand. See how we can help you grow.