Calculate Retention Ratio: Quick Guide to calculate retention ratio
Learn how to calculate retention ratio with simple methods and cohort analysis to boost loyalty and repeat sales.
Your retention ratio is simply a measure of how many customers stick around over a set period. Think of it as a direct reflection of customer loyalty and business health, showing how well you're delivering on your promises after that critical first purchase.
Why Your Retention Ratio Is Your Most Important Growth Metric
It’s easy to get fixated on chasing new customers in e-commerce. The excitement of a new sign-up or a first-time buyer often takes center stage, but that focus can mask a much bigger, more profitable opportunity: keeping the customers you already have.
Constantly acquiring new customers without retaining them is like pouring water into a leaky bucket. The real key to sustainable growth isn't just about filling the bucket faster; it's about plugging the leaks.
This is where your customer retention ratio proves its worth. It cuts through the noise of vanity metrics and tells you the unvarnished truth about your customer relationships. Are you building a loyal following, or are you just a revolving door?
The Sobering Reality of E-Commerce Churn
The fight to acquire new customers is an expensive, never-ending battle. The e-commerce world is notoriously competitive, and the numbers don't lie. The average customer retention rate hovers at a mere 38%, a figure that highlights just how tough it is to turn one-time shoppers into repeat buyers.
Price sensitivity and a sea of competitors often lure customers away. To put that 38% into perspective, it's far below the global cross-industry average of around 75%. Yet, the upside is massive: research shows that reducing customer churn by just 5% can boost profits by a staggering 25-95%. You can explore more data on industry retention rates to see just how challenging—and rewarding—this can be.
Before we jump into the "how-to" of calculating retention, let's get familiar with the key terms you'll encounter.
Key Retention Metrics at a Glance
This table offers a quick summary of the essential metrics covered in this guide. Use this as a reference to understand each component before we dive into the formulas.
| Metric | What It Measures | Why It's Important |
|---|---|---|
| Customer Retention Rate | The percentage of existing customers who continue to buy from you over a specific period. | The ultimate health check for customer loyalty and satisfaction. |
| Customer Churn Rate | The percentage of customers who stop doing business with you during a specific period. | The direct inverse of retention; highlights how many customers you're losing. |
| Repeat Purchase Rate | The percentage of customers who have made more than one purchase. | A straightforward indicator of satisfaction and the likelihood of future loyalty. |
| Customer Lifetime Value (CLV) | The total revenue you can expect from a single customer account throughout their relationship with you. | Connects retention efforts directly to long-term profitability and revenue forecasting. |
These metrics work together to paint a complete picture of your customer base, helping you move from raw data to a real growth strategy.
From Raw Data to Sustainable Growth
Getting a handle on your retention ratio fundamentally changes how you run your business. It pulls your focus away from one-off sales and directs it toward building long-term value. A healthy retention rate translates directly to tangible benefits:
- Increased Profitability: Happy, loyal customers tend to spend more over time. Plus, it costs far less to market to them than it does to find new ones.
- Stronger Brand Advocacy: A retained customer is your best marketing asset. They become brand ambassadors who refer friends and family, creating powerful word-of-mouth buzz.
- Invaluable Feedback: These are the people who will give you honest feedback, helping you pinpoint exactly what to improve in your products and overall customer experience.
By mastering this single metric, you stop guessing and start building a deliberate strategy for growth. It’s the starting point for turning raw sales data into a powerful plan for a resilient, profitable e-commerce brand.
Getting a Handle on Your Foundational Customer Retention Ratio
Before diving into complex spreadsheets, you need a simple, reliable way to calculate your retention ratio. Think of this as the pulse check for your e-commerce store. It gives you a clear, immediate snapshot of how many customers are sticking around, which is the cornerstone of sustainable growth.
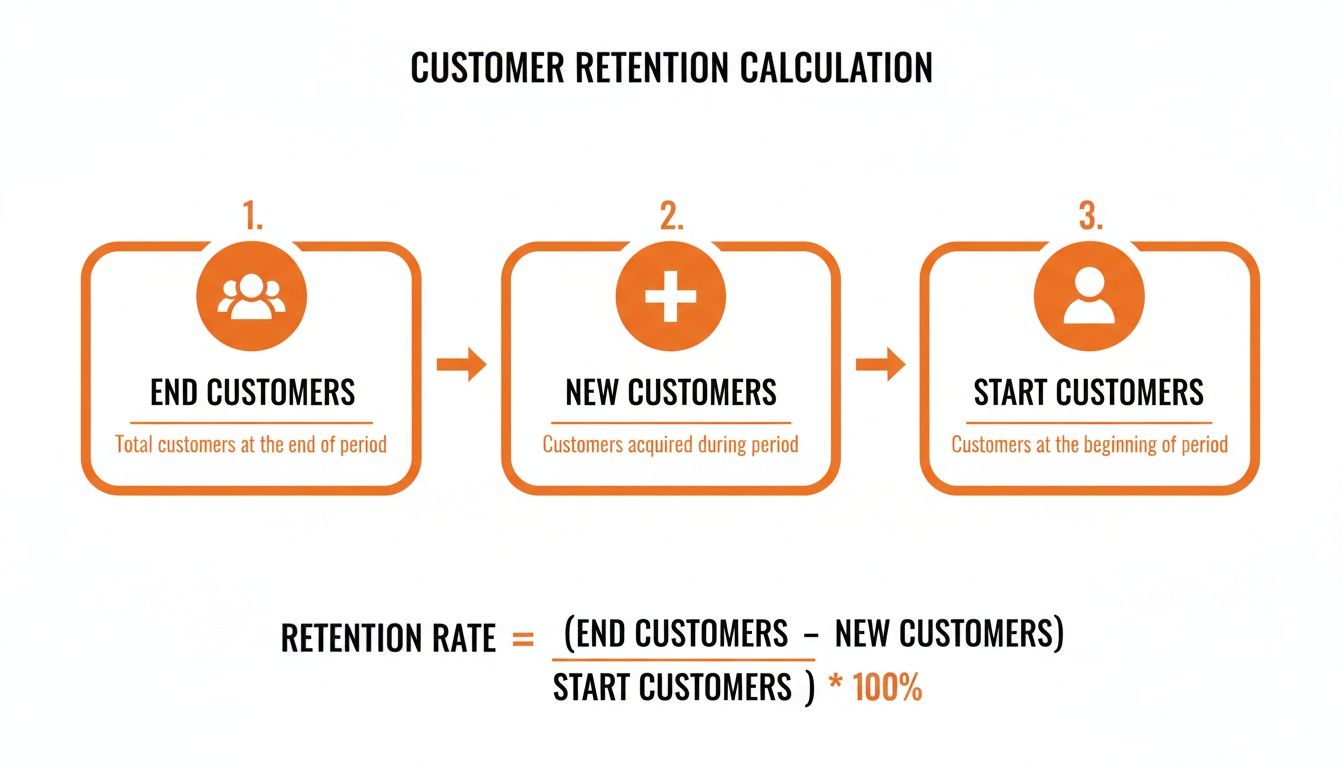
The formula is refreshingly simple. You only need to grab three numbers from your Shopify dashboard or whatever platform you're using.
( (Customers at End of Period - New Customers Acquired) / Customers at Start of Period ) * 100
Let's quickly walk through what each of those pieces actually means so you know exactly what to pull.
Gathering Your Core Numbers
The first step is grabbing the right data. Being consistent with how you define and pull these numbers is everything—it ensures you can actually trust your comparisons month after month.
Here's what you need:
- Customers at the Start of the Period (S): The total number of unique customers you had on day one of your chosen timeframe (say, the first of the month).
- Customers at the End of the Period (E): The total number of unique customers on the very last day of that same period.
- New Customers Acquired (N): The count of brand-new customers who placed their first order with you during this timeframe.
With these three numbers, you have everything you need.
Putting the Formula into Practice
Let's make this real. Imagine you run an online store selling artisanal coffee beans and you want to figure out your retention for April.
You hop into your store's analytics and pull the numbers:
- At the start of April, you had 1,200 customers (S).
- By the end of the month, that number grew to 1,350 total customers (E).
- During April, you brought in 250 brand-new customers (N).
Now, just plug them into the formula.
First, find out how many of your original customers are still there. You do this by removing the new folks from your final count: 1,350 (E) - 250 (N) = 1,100. So, you have 1,100 retained customers.
Next, see what percentage of your starting group that represents: 1,100 / 1,200 (S) = 0.9167.
Finally, turn it into a percentage: 0.9167 * 100 = 91.7%.
Boom. Your customer retention ratio for April is 91.7%. That's a powerful number. It tells you that for every 100 customers you had at the beginning of the month, nearly 92 of them were still with you at the end.
A Few Words of Caution
Calculating the ratio is easy, but making sure it's accurate requires a couple of key decisions on your part. Getting these wrong can really throw off your numbers.
The first thing to nail down is your definition of an "active customer." Is it anyone who has ever bought from you? Or is it someone who purchased in the last year? If you don't set a clear rule, you risk including long-dormant accounts in your starting number, which will artificially inflate it and make your retention look worse than it is.
The second choice is picking the right timeframe for your business.
- Monthly: This is great for fast-moving brands or if you want to see the immediate impact of a marketing campaign you just launched.
- Quarterly: This smooths out any weird monthly bumps and gives you a more stable, big-picture view of your trends.
- Annually: Best for understanding long-term loyalty, especially if you sell products people don't buy every month.
This metric isn't just a vanity number; it's a vital sign. With retail customer retention recently hitting a global low of 63%, keeping your customers is more critical than ever. Remember, acquiring a new customer costs 5-7 times more than keeping an existing one, and your loyal, returning customers spend 67% more. If you want to dive deeper, you can explore more data on the impact of retention on profitability. This simple ratio is your first line of defense.
Uncovering Deeper Insights with Cohort Analysis
The foundational retention ratio gives you a fantastic, high-level snapshot of your business's health. But to truly understand customer behavior and make smarter decisions, you need to dig deeper. A single, store-wide number can easily hide crucial trends, masking problems or concealing opportunities.
This is where cohort analysis becomes your most powerful tool.
Instead of lumping all your customers into one big, blended group, cohort analysis segments them into smaller, more meaningful buckets. A cohort is simply a group of users who share a common characteristic. For e-commerce, the most useful characteristic is their acquisition date. Think of it as grouping all the customers who made their first purchase in January into one cohort, all the February first-timers into another, and so on.
By tracking each of these groups over time, you can finally move beyond a simple "what" to uncover the "why" behind your retention numbers. It lets you see exactly how specific actions—like launching a new product in March or running a major sale in November—impacted the long-term loyalty of the customers you acquired during that time.
This detailed view helps you answer critical business questions that a single metric can't:
- Did the customers we acquired during our Black Friday sale stick around longer than those from a typical month?
- Is our new post-purchase email sequence actually improving Month 2 and Month 3 retention?
- Are customers who buy a specific introductory product more loyal in the long run?
Building Your First Cohort Analysis
Creating a cohort analysis might sound intimidating, but it’s surprisingly straightforward. All you need is a spreadsheet tool like Google Sheets or Excel and a standard customer order export from Shopify or any other e-commerce platform.
The goal is to build a grid that shows what percentage of each monthly cohort returns to make another purchase in the subsequent months.
To get started, you'll need two key pieces of data for every transaction:
- Customer ID: A unique identifier for each customer.
- Order Date: The date each purchase was made.
From this raw data, you'll first determine each customer's "acquisition month"—the month they made their very first purchase. This date assigns them to their cohort for life. Then, you just track their subsequent purchases over the following months to see how many of them stick around.
This flowchart visualizes the core components. Each cell in your cohort table is essentially a mini-retention calculation for a specific group at a specific point in time.
Practical Steps in Google Sheets or Excel
Let's say you've exported your order history. The first real task is to isolate each customer's very first purchase date. In Google Sheets, a formula like =MINIFS(OrderDateRange, CustomerIDRange, CustomerID) is perfect for finding the earliest order date for each unique customer. This date locks them into their acquisition cohort.
Once every customer is assigned to a cohort (e.g., "Jan 2024," "Feb 2024"), you can start building your table. The rows will represent each acquisition cohort, and the columns will represent the months following their acquisition (Month 1, Month 2, etc.). Each cell will then show the percentage of the original cohort that made another purchase during that subsequent month.
Why does this matter so much? Because even a small leak can sink a big ship. A 5% monthly churn rate might seem insignificant, but it compounds to erode nearly half (46%) of your customer base over a single year. That's a disaster when you consider that retained customers can deliver 2.3 times more revenue than one-time buyers. Better yet, a mere 5% increase in retention can lead to profit surges of 25-95%.
Cohort analysis turns a vague, store-wide retention number into a precise diagnostic tool. You can pinpoint exactly when and why customers are leaving, allowing you to fix the leaks in your customer journey with targeted, effective strategies.
A Worked Example of a Monthly Cohort
Let's make this real. Imagine your "January 2024" cohort consisted of 500 brand-new customers. You then track their activity over the next few months.
- In February (Month 1), 100 of them came back to make another purchase.
- In March (Month 2), 75 of them returned.
- In April (Month 3), 60 made a purchase.
To fill out your cohort table for that January group, the math is simple:
- Month 1 Retention: (100 / 500) * 100 = 20%
- Month 2 Retention: (75 / 500) * 100 = 15%
- Month 3 Retention: (60 / 500) * 100 = 12%
You’d repeat this exact process for every other cohort (February, March, etc.), creating a full table. For a deeper dive into the methodology, check out our complete guide on what is cohort analysis and how to use it.
Here's what a simplified version of that table looks like when you're done.
Example Monthly Cohort Retention Table
| Acquisition Month | Customers | Month 1 % | Month 2 % | Month 3 % |
|---|---|---|---|---|
| January | 500 | 20.0% | 15.0% | 12.0% |
| February | 650 | 22.5% | 18.2% | 14.8% |
| March | 580 | 19.5% | 14.5% | 11.2% |
This visual makes trends jump off the page. You can immediately see if your retention is improving, getting worse, or if a specific group of customers is performing differently. It stops the guesswork and lets you start making data-driven improvements to your marketing, products, and overall customer experience.
What a Good Retention Rate Actually Looks Like
So, you’ve done the math and calculated your retention rate. Maybe it’s 25%, or maybe it’s 60%. But what does that number actually mean? A retention rate without context is just a piece of data. The real power comes from understanding what "good" looks like—that’s how you turn a simple metric into a diagnostic tool for your e-commerce brand.
First off, let's get one thing straight: there’s no single magic number. What’s considered a fantastic retention rate is completely tied to your industry and the kind of products you sell. A great number for one store could be a major red flag for another.
Think about it this way: a subscription coffee company might aim for a monthly retention rate of 80% or higher. Their entire business is built on those repeat purchases. But a store selling high-end furniture might only see a customer return every few years. A much lower annual retention rate would be perfectly healthy for that business model.
Industry Benchmarks for E-commerce
While your situation is always unique, looking at industry benchmarks is a great way to get your bearings. They offer a general sense of where you stand in the market.
Here’s a rough guide to what retention often looks like across different e-commerce sectors:
- General Retail & E-commerce: A monthly retention rate hovering around 30-35% is a solid target for most online stores.
- Fashion & Apparel: This can be a bit lower, often landing between 25-30%, thanks to fast-moving trends and seasonal shopping.
- Consumables & Supplements: Because these products have a natural repurchase cycle, brands in this space often enjoy higher rates, sometimes pushing 40% or more.
If your numbers are way below these averages, it’s a clear sign that you need to dig into your customer experience. It might be an issue with your post-purchase emails, your product quality, or something else entirely.
Your real goal isn't just to hit an industry benchmark, but to establish your own baseline and improve upon it. A rate that’s steadily climbing from 20% to 25% over six months is a far better sign of health than one that’s stuck at a flat 30%.
Reading the Trends in Your Data
The true insight from retention data comes from spotting trends, especially when you’re doing cohort analysis. Think of your cohort table as a story about your customers' journey with your brand. Do you see a massive drop-off right after the first month? Or is it a slow, steady decline?
Each pattern points to a different problem you can solve.
Common Scenarios and What They Mean
- Big Drop After Month 1: This is the classic sign of a weak onboarding or post-purchase experience. The customer was excited about their first buy but then heard nothing from you. They felt like a one-time transaction, not a valued customer.
- Steep Decline Around Month 3: This often points to a product or content problem. Your customers liked what they bought initially but haven't found a compelling reason to come back. Maybe you haven't released new products that appeal to them, or your marketing has simply gone dark.
- A Healthy, Gradual Decline: No one retains 100% of customers forever—that’s just not realistic. A gentle, flattening curve in your cohort data is what you want to see. It shows you're building a core group of loyal fans who are sticking around for the long haul. That’s the goal.
By learning to read these signals, you can shift from just measuring retention to actively improving it. To dig deeper, check out our guide on other essential client retention metrics. This process turns your retention rate from a passive report card into an active roadmap for building a stronger, more profitable brand.
Practical Strategies to Improve Your Retention Ratio
Knowing your retention numbers is one thing. Actually improving them is where the real growth happens. Once you can consistently calculate retention ratio trends, you can start launching specific strategies to turn those numbers around. The goal is simple: turn one-time buyers into repeat customers who feel a real connection to your brand.
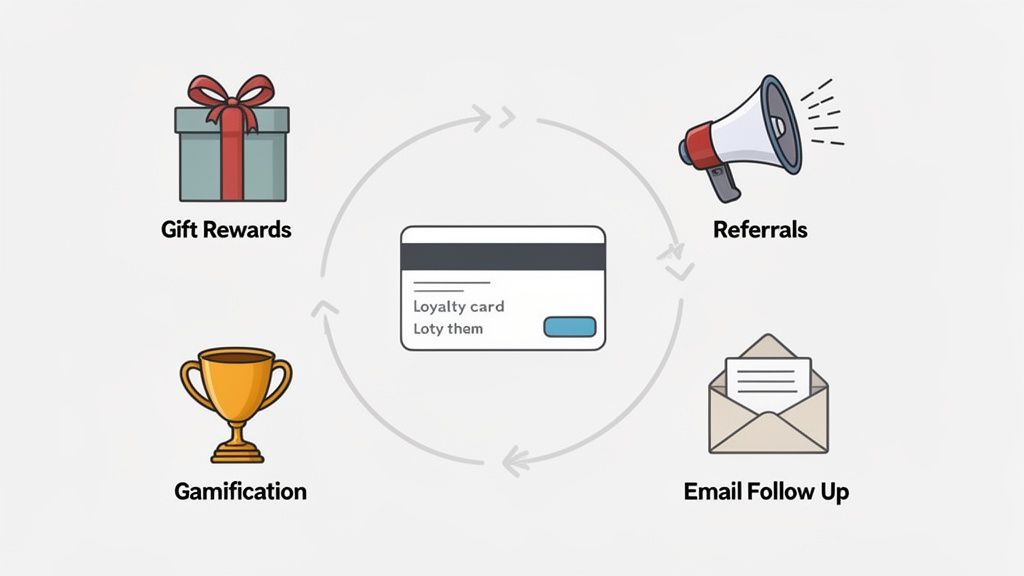
This isn't about guesswork. It’s about building systems that give people compelling reasons to come back. The cornerstone of this whole effort is a modern loyalty program—something that goes way beyond the old-school punch card.
Build a Modern Loyalty Program
A well-designed loyalty program is your most direct lever for boosting retention. It’s a value exchange that goes beyond the first purchase, making customers feel seen and rewarded for sticking with you. Forget the one-size-fits-all approach; the programs that work today are layered, engaging, and genuinely fun.
Here are a few powerful loyalty structures I've seen work time and again:
- Point-Based Rewards: This is a classic for a reason—it’s simple and it works. Customers earn points for purchases, reviews, or social shares, which they can cash in for discounts, free products, or special access.
- Tiered Memberships: Tiers add a bit of a game to the shopping experience. As customers spend more, they unlock new levels with better perks, like free shipping or a higher points-earning rate. It gives people a clear goal to shoot for.
- Paid Memberships (VIP Programs): Got a core group of die-hard fans? A paid VIP program can be a goldmine. They pay a recurring fee for instant access to your best benefits. Think Amazon Prime—it creates a powerful psychological nudge to shop more often to "get their money's worth."
The key is to make the rewards feel both attainable and desirable. If the perks are lame or the points needed are astronomical, people will tune out fast. Your program should feel like an exciting part of the experience, not a chore.
Turn Customers into Brand Advocates
Your happiest customers are your best marketers. Period. When you empower them to spread the word, you not only get high-quality new leads but also strengthen their own loyalty in the process. This is exactly what referral and affiliate programs are built for.
A solid referral program gives everyone a reason to participate. The current customer gets a reward (like store credit), and their friend gets a discount on their first order. It's a win-win that drives both new sales and repeat business. Platforms like Toki can handle all the backend work, making it totally seamless for everyone.
You can even add some gamification to supercharge these efforts. Try creating challenges or awarding badges for milestones like "First Successful Referral" or "Top Advocate of the Month." These little touches create a sense of community and friendly competition, keeping customers engaged long after they've bought something. If you're looking for more ideas, you’ll find that many SaaS customer retention strategies can be brilliantly adapted for e-commerce.
Foster a Sense of Community
People want to buy from brands they feel connected to. Building a community turns a simple transaction into an emotional relationship, and that sense of belonging is a powerful advantage that competitors just can't copy.
Think beyond just selling stuff. How can you create a space for your customers to connect?
- Exclusive Content: Give loyalty members a peek behind the scenes with tutorials, Q&A sessions, or early product reveals.
- User-Generated Content: Encourage customers to share photos of them using your products. Feature their content on your social channels to make them feel like a star.
- Feedback and Involvement: Ask your best customers for their input on new product ideas. Making them feel like part of the process builds incredible loyalty.
By investing in these strategies, you give customers more reasons to choose you again and again. These efforts are what move the needle when you calculate retention ratio, turning it from a static number into a dynamic indicator of your brand's health. For a deeper look, check out our guide to improving customer loyalty.
Common Questions When Calculating Retention
Once you start pulling retention numbers regularly, a few tricky questions always seem to surface. The basic formula looks simple enough on paper, but real-world customer data loves to throw curveballs. Let's walk through the most common sticking points I see so you can get your analysis right from the start.
Getting these details sorted out is what separates a vanity metric from a truly useful one that can guide your business decisions.
Should I Count Refunded Customers?
This is easily the most common question, and the answer isn't a simple yes or no. The right call really depends on what you're trying to measure.
Think about it this way: a customer is usually defined by a transaction. If someone makes a purchase but then gets a full refund without an exchange, they've essentially undone that action. Counting them as a "new customer" for that period can muddy the waters.
Here’s how I approach it:
- For straight retention analysis: I typically exclude fully refunded, non-exchanged orders. This gives a much cleaner picture of customers who had a real, lasting first experience with the brand.
- For customer experience insights: You absolutely should track these customers, just separately. A high rate of first-time buyers who immediately ask for a refund is a huge red flag. It could point to anything from misleading product photos to a clunky checkout process.
The most important thing is to be consistent. Pick a rule for your business and apply it every single time you calculate retention. That way, you're always comparing apples to apples.
My rule of thumb is to pull refunded customers out of the retention calculation itself but to watch the "first-time purchase refund rate" like a hawk as its own separate health metric. This keeps the retention metric focused purely on loyalty while still flagging potential issues elsewhere.
Weekly vs. Monthly vs. Quarterly Periods
Choosing the right time frame is another spot where people get tangled up. There’s no magic answer here; the best period depends entirely on your business model and how often your customers naturally buy from you.
Here's a quick guide based on what I've seen work:
- Weekly Cohorts: This is your go-to for fast-moving products. Think coffee, groceries, or certain cosmetics where a customer might realistically buy again within a few weeks. It's also fantastic for measuring the immediate impact of a flash sale or a big marketing campaign.
- Monthly Cohorts: This is the sweet spot for most e-commerce stores and the one I recommend starting with. It smooths out the random noise of weekly fluctuations, giving you a stable and actionable view of customer loyalty.
- Quarterly Cohorts: Use this for products with a much longer buying cycle. If you sell furniture, high-end electronics, or specialty seasonal gear, looking at monthly retention can be misleading. No one expects a customer to buy a new sofa every month.
When in doubt, start with a monthly analysis. If the data feels jumpy or doesn't seem to match the reality of your business, then you can experiment with a shorter or longer timeframe.
Ready to turn these retention insights into real growth? Toki provides all the tools you need to build a powerful loyalty, membership, and referral program that keeps customers coming back. See how you can boost your retention ratio by visiting https://buildwithtoki.com.