How to Calculate Client Retention Rate for E-Commerce Growth
Learn how to calculate client retention rate with practical formulas and expert tips. Turn your Shopify store data into a powerful tool for customer loyalty.
Here’s the simple formula to get started: [(Ending Customers - New Customers) / Starting Customers] x 100. This calculation gives you the percentage of existing customers you held onto over a set period—a critical health check for any e-commerce business.
Why Retention Rate Is Your E-Commerce Superpower
It’s easy to get caught up in the acquisition game. Many e-commerce merchants are on a treadmill, constantly pouring money into ads just to bring new people through the door. But this "leaky bucket" approach is incredibly expensive and, frankly, exhausting.
The real engine for sustainable, profitable growth isn't just getting new customers; it's keeping the ones you’ve already earned.
When you focus on retention, you shift your business from purely transactional to truly relational. It’s the difference between a one-time sale and a long-term partnership with your customers. That simple change creates a powerful ripple effect that can transform your entire operation.
The Profitability Engine
The numbers don't lie. Globally, a staggering 80% of future profits often come from just 20% of existing customers. On top of that, attracting a new customer can cost five to seven times more than keeping a current one.
In a world where the average e-commerce retention rate hovers around a mere 38%, building loyalty isn't just a nice-to-have; it's a massive competitive advantage.
Retained customers are simply more valuable over time. They tend to:
- Spend More: Loyal customers typically have a higher average order value (AOV) and come back to buy more often.
- Cost Less to Serve: They already know your products and policies, which means less hand-holding and fewer support tickets.
- Become Brand Advocates: A happy, long-term customer is your best marketing asset, spreading the word far more effectively than any ad campaign.
By shifting even a small slice of your focus from acquisition to retention, you can unlock outsized gains in profitability and build a much more resilient brand. It’s about working smarter, not just spending more.
A Strategic Guidepost
Ultimately, your client retention rate is more than just a metric—it’s a compass for your business.
A rising rate tells you that your products, customer service, and overall experience are hitting the mark. A falling rate, on the other hand, is an early warning signal. It’s your chance to dig in and find out what's wrong before the problem gets bigger.
Of course, to truly make retention a superpower, you first need to bring in high-quality customers worth keeping. That's where mastering modern e-commerce advertisement strategies comes into play. Once you have them, understanding this metric is the first step toward building a business that doesn't just survive on transactions but thrives on genuine loyalty.
Figuring Out Your Baseline Retention Rate
Before you can improve loyalty, you need a starting point. Let’s get our hands dirty with the math and calculate your store's client retention rate using a simple, powerful formula. This number is your benchmark—the figure you’ll work to improve over time.
The good news is that the core formula is pretty straightforward. You only need three pieces of data from your e-commerce platform (like Shopify or BigCommerce) for a specific time frame, whether it's a month or a quarter.
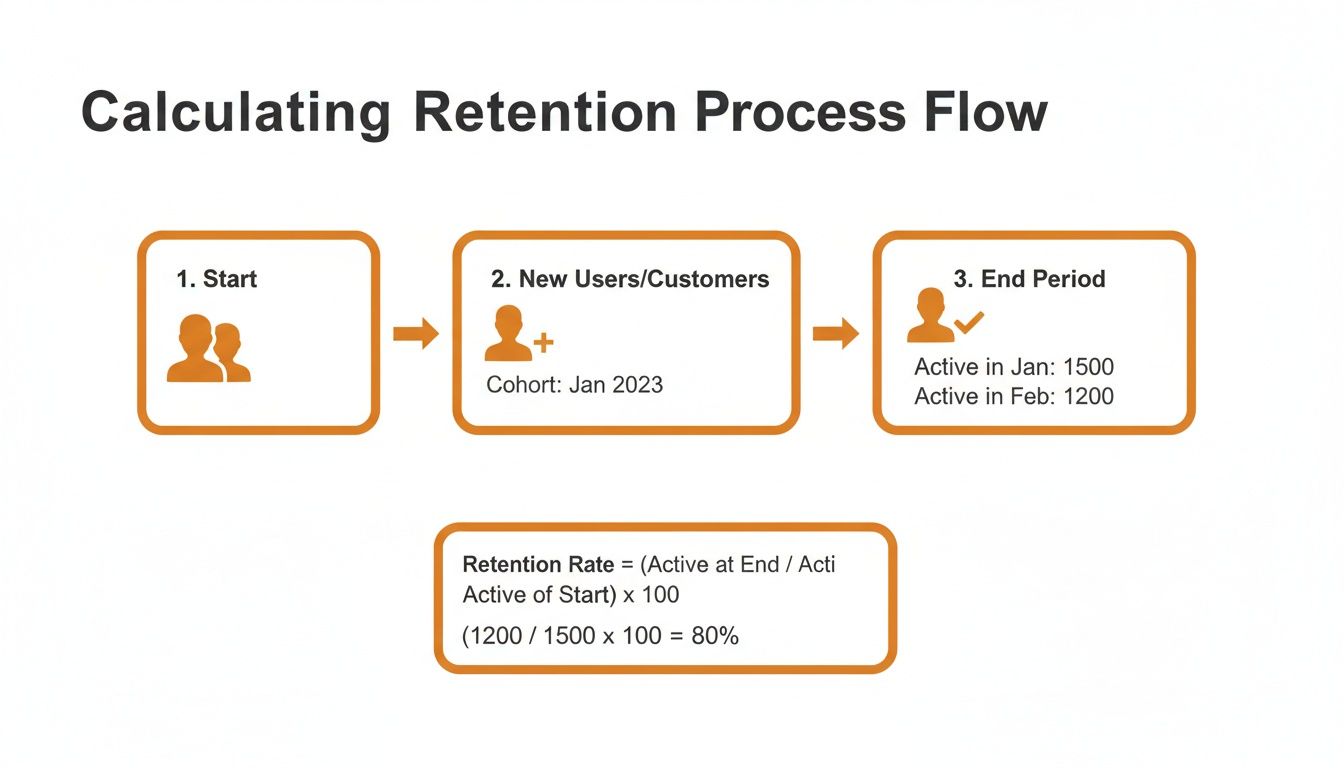
The Core Retention Formula
Here's the calculation you'll use: [(E - N) / S] x 100 = Client Retention Rate
It might look a little intimidating at first, but it’s really simple once you know what the letters stand for. Let's break down each variable and where to find the info.
- S (Start): This is the total number of customers you had at the very beginning of the period you're measuring.
- E (End): This is the total number of customers you had at the very end of that same period.
- N (New): This is the number of brand-new customers you brought in during that period.
What we're doing here is stripping out the new customers from your final count to see how many of the original customers actually stuck around. This is a critical distinction. It’s not just about overall customer growth; it’s about loyalty.
This metric gives you a much clearer picture of satisfaction than just looking at your repeat purchase rate. If you want to dig deeper into that, we have a whole guide on the repeat purchase rate formula.
To make this even clearer, here’s a quick reference table.
Client Retention Rate Formula Breakdown
| Variable | Symbol | What It Means | Where to Find It (Example) |
|---|---|---|---|
| Starting Customers | S | The total number of unique customers on Day 1 of your period. | Shopify Admin > Customers > Filter by date created before your start date. |
| Ending Customers | E | The total number of unique customers on the last day of your period. | Shopify Admin > Customers > Filter by date created before your end date. |
| New Customers | N | The number of unique customers acquired during the period. | Shopify Admin > Analytics > Reports > "First-time vs returning customers". |
This table should help you quickly pull the right numbers from your store's backend without any confusion.
A Real-World Example: ‘Artisan Roast Collective’
Let's walk through an example to see how this works in practice.
Imagine you run a Shopify store called ‘Artisan Roast Collective’ and you want to figure out your retention rate for the last quarter (Q2, from April 1st to June 30th).
First, you pull the numbers from your store's dashboard:
- Customers at the Start (S): On April 1st, you had 1,200 total customers in your system.
- Customers at the End (E): By June 30th, that number has grown to 1,450.
- New Customers Acquired (N): A quick report shows you acquired 300 brand-new customers during Q2.
Now, we just plug those numbers into our formula.
Formula in Action:
Retention Rate = [ (1,450 - 300) / 1,200 ] x 100 Retention Rate = [ 1,150 / 1,200 ] x 100 Retention Rate = 0.9583 x 100 Retention Rate = 95.8%
Boom. The result shows that ‘Artisan Roast Collective’ held onto nearly 96% of its existing customers from the beginning of the quarter.
That’s a fantastic number. It’s a strong signal that your coffee and customer experience are really hitting the mark. By tracking this number every month or quarter, you gain a powerful, at-a-glance tool for understanding the true health of your business.
Uncovering Deeper Insights with Cohort Analysis
That baseline retention rate you just calculated? It’s a great starting point—a quick pulse check on your business. But it's also just a single snapshot in time. To truly understand customer loyalty, you need to see the whole movie, not just one frame.
This is where cohort analysis comes into play. It’s a powerful way to see how your customer relationships evolve over the long haul.
Think of a customer cohort as a graduating class. It’s simply a group of customers who all started at the same time. For an e-commerce store, the most practical way to group them is by the month they made their first purchase. So, everyone who first bought from you in March becomes the "March Cohort."
By tracking each of these "classes" separately, you can finally move beyond a single, blended retention number and start asking much more strategic questions.
The process boils down to separating your existing customers from new ones to see who is actually sticking around.
This kind of analysis shows you the real health of your customer relationships over time.
Why Cohort Analysis Is a Game-Changer
Tracking cohorts lets you connect the dots between your actions and customer loyalty. For example, you might discover that the cohort you acquired during your big Black Friday sale has an awful retention rate two months later. That tells you they were just one-off deal hunters.
On the other hand, the group that came in when you launched a new product line in May might show incredible long-term loyalty. Now you know that product really resonates and attracts high-quality customers.
This level of detail is critical. Across the e-commerce industry, the average retention rate hovers around a modest 30%. Since returning customers can spend 67% more than new ones, figuring out which groups beat that average is where the money is. For subscription brands, where strong retention can drive rates up to 67%, this isn't just important—it's everything.
Cohort analysis tells you when you are losing customers. If you consistently see a major drop-off in month three across all cohorts, you know there's a problem with your post-purchase experience at that specific point in the journey.
Building a Simple Cohort Table
You don't need a fancy business intelligence tool to get started. You can build a perfectly useful cohort analysis right in a spreadsheet. The goal is to track what percentage of each monthly cohort returns to make another purchase in the months that follow.
Here’s a simplified version of what that looks like:
| Acquisition Month | Month 1 | Month 2 | Month 3 | Month 4 |
|---|---|---|---|---|
| January Cohort | 100% | 45% | 38% | 32% |
| February Cohort | 100% | 42% | 35% | 30% |
| March Cohort | 100% | 55% | 48% | 41% |
Look at that. Something clearly went right in March. Maybe that's when you launched your new loyalty program or revamped your onboarding emails. Whatever it was, the March Cohort is sticking around much longer than the previous groups.
This is the kind of actionable insight you would completely miss by only looking at a single, overall retention rate. It allows you to directly measure the real impact of your marketing campaigns, product changes, and customer service efforts on long-term loyalty.
If you're ready to go even deeper, check out this guide on what is cohort analysis and how to use it.
Avoiding Common Retention Calculation Mistakes
Getting your client retention rate right is the bedrock of smart business decisions. But it's surprisingly easy to make a small misstep in the data that throws your numbers way off, potentially sending you down the wrong strategic path. Think of this as your guide to dodging those common pitfalls so you can trust the metrics you're tracking.
Comparing Apples to Oranges with Timeframes
One of the most frequent errors I see is comparing inconsistent time periods. Let's say you calculate your retention rate for February (which has 28 days) and then stack it up directly against March (31 days). That’s not a fair fight.
The longer month naturally gives customers more time to make a repeat purchase, which can create the illusion that your retention is improving when it’s really just a calendar quirk.
The fix is simple: standardize your measurement windows. Always compare months of the same length, or better yet, use a consistent 30-day or 90-day rolling window. This way, you’re measuring real shifts in customer behavior, not just the calendar.
Misinterpreting Who Really Counts as a Customer
Another major tripwire is a fuzzy definition of an "active" or "retained" customer. For example, what about the person who only ever buys from you during the holidays, likely for a gift? Should they be counted against your retention numbers if they don't come back in Q1? Probably not. Their buying intent is completely different from your typical customer.
To get a clearer picture, you have to segment your customer data.
- Filter out obvious one-time gift buyers.
- Exclude customers who only purchased deeply discounted, clearance items.
These groups often behave differently and can muddy the waters when you’re trying to understand the loyalty of your core shoppers.
A clean dataset is your most powerful tool. The old saying "garbage in, garbage out" isn't just a cliché; it's a serious warning. Taking the time to filter your data ensures your retention rate actually reflects the health of your core business.
The New vs. Returning Customer Mix-Up
Finally, a surprisingly common slip-up is misclassifying customers in your formula. Imagine a customer bought from you two years ago, went quiet, and then popped back up to buy something this month. Depending on how your system is set up, they might be accidentally flagged as a "new" customer if your dashboard is only looking at a narrow time window.
This simple error deflates your true retention rate because it takes a returning customer out of the "retained" bucket and puts them in the "new" bucket.
To prevent this, make sure your analytics tools are configured to look at a customer's entire lifetime history with your brand. A customer is only truly new on their very first purchase. Any purchase after that, no matter how much time has passed, makes them a retained customer. Nailing this definition is absolutely crucial for an accurate calculation.
By sidestepping these common errors, you can be confident that your efforts to calculate client retention rate are giving you reliable, actionable insights for your store.
Turning Retention Data into Actionable Strategy
 Once you have your client retention rate, you're holding more than just a number—it’s a diagnostic tool for your business. The real value isn't in the calculation itself, but in what you do with it next. A standalone metric is pretty meaningless, but when you know how to read the signs, that single percentage can reshape your entire strategy.
So, what’s a "good" retention rate anyway? While you might see industry averages floating around 30-38% for e-commerce, the only benchmark that truly matters is your own past performance. The goal isn't to hit some magic universal number; it's to create a consistent, upward trend. A sudden dip is your cue to investigate, and a steady climb is confirmation that your recent efforts are paying off.
Segment Your Customers to Find the Gold
Your overall retention rate is a blended average, and averages can be deceiving. They hide the most interesting parts of the story. The most powerful next step is to slice up your customer base into segments to figure out who is staying and, just as importantly, why. This is how you move from broad guesses to precise, effective action.
Start by grouping your customers in ways that make sense for your business:
- By First Product Purchased: Do customers who buy your signature coffee blend stick around longer than those who just grab a promotional mug? This tells you which products create true fans versus one-time buyers.
- By Acquisition Channel: Are the customers you acquire from Instagram ads more loyal than the ones who find you through organic search? Answering this helps you pour your marketing budget into the channels that deliver real long-term value.
- By Customer Lifecycle Stage: New customers, repeat buyers, and at-risk customers all need something different from you. Segmenting this way allows you to create targeted campaigns, like a special welcome offer for newbies or a win-back email for those who've gone quiet.
Build Your Action Plan
With these fresh insights, you can finally build a focused retention marketing strategy. For retail brands, the stakes are massive—global customer churn drains an estimated $1.6 trillion from businesses every single year. This is exactly what loyalty platforms are designed to combat; research shows that 72% of loyalty program members are more likely to stick around.
Even simple, personalized tools can make a huge difference. For example, a good abandoned cart recovery flow can bring back up to 48% of would-be lost sales, which directly props up your retention numbers.
Your data gives you a clear business case for specific investments. Try thinking about it with this simple framework:
- Identify the Problem: "Our retention rate for all new cohorts drops off a cliff after the second month."
- Form a Hypothesis: "I bet our post-purchase communication isn't engaging enough to bring them back for a third purchase."
- Propose a Solution: "Let's roll out a targeted email sequence that offers a compelling discount or early access to a new product right around the 45-day mark."
Your data tells a story about what your customers truly value. If you see high retention among shoppers who actually engage with your loyalty program, it's a flashing neon sign to double down on your rewards and community-building efforts.
Beyond just crunching numbers, an effective retention strategy often comes down to optimizing the customer experience. Advanced tools can definitely help streamline this. It might be worth exploring platforms like the supportgpt platform to level up your customer service interactions.
Ultimately, turning data into action means listening to what your numbers are telling you and building a business that people genuinely want to come back to. For a deeper dive, check out our guide on building a powerful https://www.buildwithtoki.com/blog-post/retention-marketing-strategy.
Common Questions About Client Retention Rate
Once you start tracking your client retention rate, a few practical questions almost always pop up. Answering them is what turns this metric from just another number into a powerful tool that can actually steer your e-commerce strategy. Let's dig into the most common ones I hear from merchants.
How Often Should I Calculate My Retention Rate?
For most e-commerce brands, monthly is the sweet spot. This frequency is perfect for catching trends and seeing how well a recent marketing campaign or product drop performed. It gives you enough data to be meaningful without getting lost in the noise of daily ups and downs.
On top of that, I always recommend looking at the numbers quarterly and annually. These bigger-picture views are where you’ll spot long-term loyalty patterns and get a real sense of your brand's overall health.
Now, if you've just rolled out something big—like a new loyalty program—you might want to peek at the numbers weekly for the first month. This gives you a much faster feedback loop to see if it’s actually working.
What Is a Good Client Retention Rate for E-Commerce?
This is the million-dollar question, isn't it? But there’s no magic number. You'll often see industry benchmarks floating around the 30-38% mark, but a "good" rate really depends on what you sell and how you sell it.
Let's get specific:
- A subscription box service would be thrilled with 65% retention or higher, since their entire model is built on repeat purchases.
- A store selling high-ticket furniture, on the other hand, would naturally have a much lower rate because people don't buy a new sofa every month.
Instead of obsessing over a universal average, focus on improving your own baseline. Your real competition is your store's performance from last quarter. That's what sustainable growth looks like.
Can I Calculate Retention for Specific Segments?
Yes, and you absolutely should. This is where the gold is buried. A single, store-wide rate gives you a starting point, but segmenting your customers is how you find the why behind that number.
Think about creating cohorts based on shared traits. This lets you see which groups are sticking around and which ones are churning. For example, you could calculate retention for customers based on:
- The first product they bought: This helps you pinpoint which of your products are true "gateway" items that create your most loyal fans.
- The marketing channel that brought them in: Are customers from TikTok ads sticking around longer than those from organic search? This tells you where to put your marketing dollars for long-term value, not just quick wins.
Diving into your data this way is how you move from simply measuring retention to actively improving it.
Ready to turn these insights into a powerful loyalty engine for your store? With Toki, you can build tiered memberships, referral programs, and engaging reward systems that keep your best customers coming back. Learn how Toki can boost your retention today.