What Is Behavioral Analytics?
Discover what is behavioral analytics and how it moves beyond page views to reveal the 'why' behind user actions. Learn to unlock actionable customer insights.
So, what exactly is behavioral analytics? Think of it less as a tool and more as a way of understanding the story behind the numbers. It’s all about digging into how people actually interact with your website or app to figure out the why behind their actions.
This approach goes way beyond surface-level metrics like page views or session counts. Instead, it pieces together the full user journey—every click, scroll, and navigation choice—to give you a complete picture.
Uncovering the Story Behind the Numbers
Imagine you're looking at your website data. A traditional tool like Google Analytics might tell you that 50% of your visitors abandoned their cart at the checkout page. That's the what. It's a critical piece of information, for sure, but it doesn't tell you anything about why it happened. It's like knowing a window is broken but having no other clues to go on.
Behavioral analytics is the detective work. It shows you the digital footprints, the moments of hesitation, and the exact path a user took before they decided to leave. Did they get confused by the shipping options? Did a promo code field distract them? This is the context that turns a simple number into an actionable insight.
How It Differs From Traditional Analytics
The fundamental difference comes down to focus. Traditional analytics gives you a fantastic high-level view of your website's performance, summarizing what happened across large groups of users. Behavioral analytics, on the other hand, zooms in on individual user actions to explain the motivations that drive those outcomes.
It's this shift from aggregated data to user-centric stories that really makes a difference. To learn more about this approach, check out our guide on understanding customer behavior analytics for deeper insights.
This focus on user intent is why the market is growing so fast. The global behavior analytics market, valued at around USD 1.10 billion, is projected to hit USD 10.80 billion by 2032. Businesses are realizing they need to understand these customer patterns to stay competitive. You can see more about these market trends and forecasts on fortunebusinessinsights.com.
By tracking the sequence of user actions, businesses can identify points of friction, discover what features delight customers, and ultimately build better products. It’s about transforming raw data into a clear narrative of the customer experience.
Let's break down the key distinctions between the two approaches.
Traditional Analytics vs Behavioral Analytics
| Aspect | Traditional Analytics (The 'What') | Behavioral Analytics (The 'Why') |
|---|---|---|
| Primary Question | What happened on my site? | Why did it happen and what does it mean? |
| Core Focus | Aggregated data (e.g., page views, sessions) | Individual user actions (e.g., clicks, scrolls) |
| Key Insight | Measures website performance and traffic | Uncovers user intent and motivation |
| Typical Use Case | Reporting on overall traffic trends | Optimizing user journeys and conversion funnels |
Ultimately, you need both. Traditional analytics tells you where to look for problems, while behavioral analytics helps you understand what those problems actually are and how to fix them.
Understanding Core Behavioral Analytics Concepts
To really get what behavioral analytics is all about, you have to look at its core components. It’s not just about passively watching what people do on your site. It’s about methodically breaking down their actions into specific data points that, together, tell a story. This is how we turn a flood of raw clicks and scrolls into a clear picture of what a user actually wants.
At the heart of it all are events. An event is simply any meaningful action a user takes—clicking ‘Add to Cart,’ filling out a form, watching a video, you name it. Each event is a breadcrumb, a tiny clue that helps you understand their journey.
But events alone are just part of the story. They become much more powerful when you add user properties. Think of these as descriptive tags for each user, like their device (mobile vs. desktop), how they found you (organic search vs. a social media ad), or where they’re located. When you combine events with properties, you go from knowing what happened to understanding who did it.
This infographic does a great job of showing the shift from old-school analytics, which tells you the 'what,' to behavioral analytics, which gets you much closer to the 'why'.
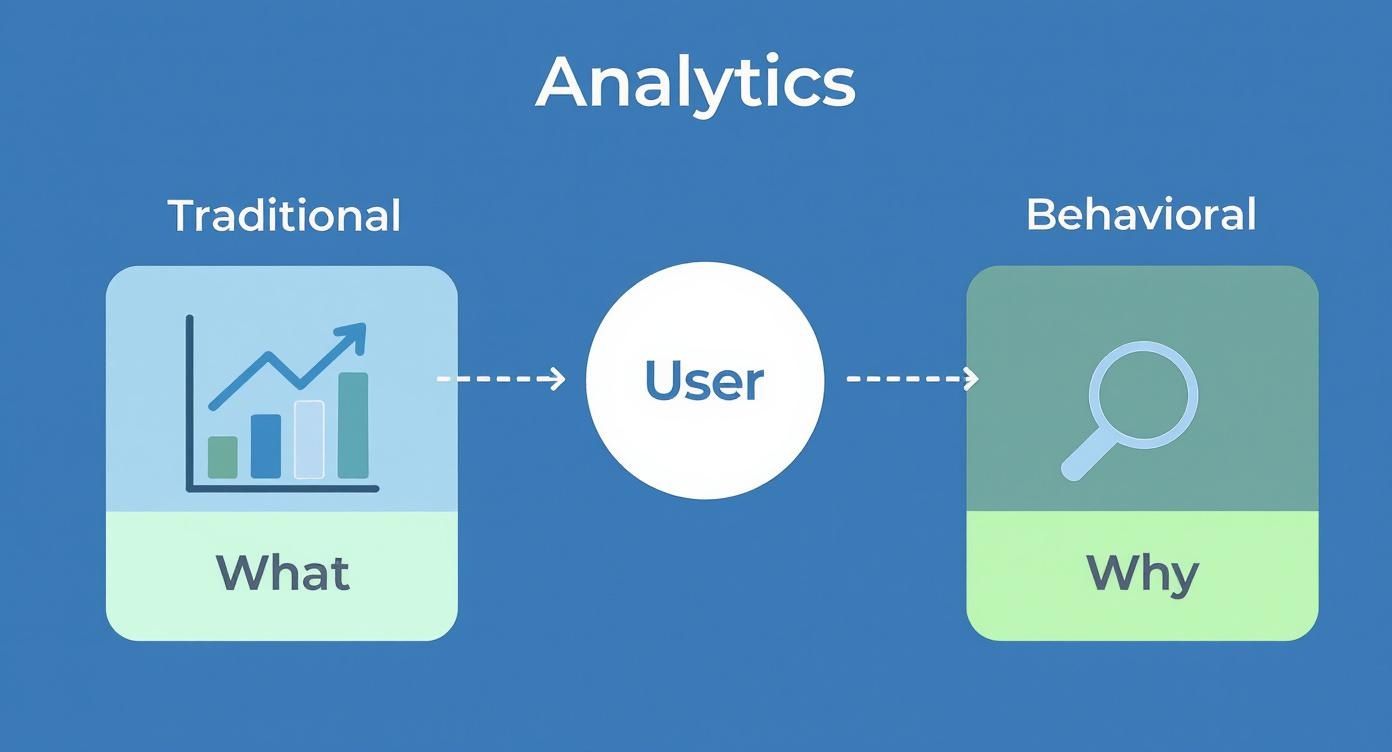
As you can see, it’s about moving beyond simple metrics to get a deeper, more contextual view of what motivates people. This detailed approach is a big part of how experts analyze website traffic and find patterns they can actually act on.
Key Methodologies for Analysis
Once you’re tracking all these events and properties, you can start using some powerful techniques to make sense of it all. This is where the magic happens, turning a mountain of data into real business intelligence.
Segmentation
One of the most effective methods is segmentation. This is where you group users together based on shared actions or attributes. For instance, you could create a segment of "first-time visitors from the UK who added an item to their cart in the last 7 days but didn't buy." Isolating this group lets you analyze their specific journey and figure out how to nudge them over the finish line. Our guide on what is behavioral segmentation goes deeper into how this powers personalization.
Funnel Analysis
Another go-to technique is funnel analysis. Funnels map out the key steps a user takes to reach a goal, whether it’s signing up for a newsletter or completing a purchase. It’s an incredibly visual way to pinpoint exactly where people are dropping off, showing you the biggest roadblocks in your customer’s path.
For example, a funnel might show that 80% of users who start checkout leave on the shipping information page. That’s a massive red flag telling you to go fix that step immediately.
Cohort Analysis
Finally, there's cohort analysis. This groups users based on when they first signed up or made a purchase, and then tracks their behavior over time. It’s the best way to see how engagement changes from one week to the next and to understand if your recent product updates are actually improving long-term retention. By comparing cohorts, you can measure the real impact of your efforts.
Key Metrics That Reveal User Intent
To really get what’s happening behind the scenes, you have to look past flashy numbers like page views. Sure, big numbers feel good, but they don't tell you a thing about what a person actually wants or finds valuable on your site. This is where behavioral analytics comes in—it focuses on metrics that show intent, giving you a much clearer picture of what your users are actually experiencing.
Instead of just counting clicks, we need to ask what those clicks are meant to accomplish. It’s a shift in focus toward KPIs that truly show whether your product is solving a real problem for someone. These are the numbers that connect user behavior directly to crucial business goals like keeping customers around and growing revenue.
Measuring Engagement And Value
One of the most revealing metrics you can track is the feature adoption rate. This number tells you exactly how many people are actually using a specific feature, which is especially important for new rollouts. If the adoption rate is low, it’s a huge red flag—maybe the feature is buried, confusing, or just doesn't solve a problem your users have. It’s a direct signal telling you whether your product updates are hitting the mark or falling flat.
Another game-changer is time-to-value (TTV). This measures how long it takes a brand-new user to experience that "aha!" moment where they understand the core benefit of your product. For an e-commerce brand, that might be their first purchase. For a software tool, it could be completing a key workflow for the first time. The faster you can get them to that point, the better. A short TTV is one of the strongest predictors of long-term retention because people who find value quickly are far more likely to stick around.
By tracking TTV, you can pinpoint the exact friction points in your onboarding. If it takes too long for users to feel that spark, you risk losing them before they ever see what your product can really do.
Finally, a user engagement score is a fantastic way to roll several actions—like logins, feature usage, and session length—into a single, powerful metric. This score helps you see at a glance how active different groups of users are. Even better, it acts as an early warning system, helping you spot which customers are at risk of churning long before they actually leave.
Tracking User Behavior Over Time
Looking at these metrics as a one-time snapshot is helpful, but the real magic happens when you track them over time. This is where you get the full story. Techniques like cohort analysis are perfect for this. By grouping users based on when they signed up, you can watch how their engagement and loyalty change from one week or month to the next. For a complete walkthrough, our guide explains what is cohort analysis and how it uncovers those critical long-term trends.
Let's pull these key metrics together into a simple table to see how they connect user actions to business results.
Actionable Behavioral Analytics Metrics
| Metric | What It Measures | Business Impact |
|---|---|---|
| Feature Adoption Rate | The percentage of users who engage with a specific feature. | Indicates if product updates are valuable and resonating with users. |
| Time-to-Value (TTV) | How quickly a new user finds the core value of your product. | Directly influences new user retention and reduces initial churn. |
| User Engagement Score | A composite score measuring a user's overall activity level. | Helps predict customer loyalty and identify at-risk users proactively. |
By focusing on these intent-driven metrics, you’re no longer just watching what people do. You're starting to understand why they do it. That insight is what allows you to make smart, data-informed decisions that genuinely improve the customer experience and lead to real, sustainable growth.
Real-World Applications in Ecommerce and Loyalty
It’s one thing to talk about behavioral analytics in theory, but seeing it in action is where the magic really happens. For e-commerce brands, understanding how users behave is the engine behind creating personalized shopping experiences that don't just feel good—they drive sales and build real customer relationships. It's how you turn a casual browser into a committed buyer.
Think about the last time an online store showed you a "You might also like" section that was so spot-on it was almost scary. That wasn't a lucky guess. That was behavioral analytics at work, tracking your clicks, what you've looked at before, and what people with similar tastes have bought. By digging into these actions, brands can make an educated guess about what you'll want next.
Powering Personalized Recommendations
The big players in e-commerce use behavioral data to build incredibly smart recommendation engines. They follow every product a user clicks on, what they add to their cart (and just as importantly, what they take out), and their purchase history. All this information gets woven together to create a rich profile of a shopper's tastes and needs.
This data allows them to do some pretty cool things:
- Suggest Complementary Products: Someone just bought a new camera? The system can immediately suggest a compatible lens or a sturdy camera bag, nudging up the average order value.
- Personalize the Homepage: A returning visitor shouldn't see the same generic homepage. Instead, they can be greeted with a curated selection of products based on what they've previously browsed.
- Refine Search Results: The search bar gets smarter, too. It learns to prioritize items that match a user’s known preferences, making it easier for them to find what they're looking for.
This isn't just about showing people more stuff; it's about making them feel seen and understood. It turns a generic online store into a personal shopper, and that's a powerful way to turn a first-time buyer into a lifelong fan.
Enhancing Customer Loyalty Programs
Modern loyalty programs are another area where behavioral analytics shines. It’s not just about counting points anymore. Platforms like Toki dig much deeper, analyzing purchase frequency, how often members redeem rewards, and which special offers they engage with. This gives brands a crystal-clear picture of who their most valuable customers are and, crucially, who might be about to leave.
Take a look at this dashboard from Toki. It’s a great example of how a loyalty platform visualizes the data that matters, giving a business a quick health check on its program.
With a glance, a store owner can see how many members are actively earning and spending rewards—a direct measure of how engaged their customer base truly is.
By keeping an eye on behaviors like a sudden drop-off in purchases or a member sitting on a pile of unspent points, a loyalty platform can flag an account as "at-risk." This can automatically trigger a targeted campaign to win them back before they're gone for good.
For example, if a previously loyal customer hasn't bought anything in 60 days, the system can be set up to send them an exclusive "We miss you" offer with some bonus points. This proactive, data-driven approach is a whole lot more effective than trying to win back a customer who has already mentally checked out. It’s a perfect illustration of how understanding user actions directly boosts customer lifetime value.
The Critical Role in Cybersecurity and Fraud Detection
Behavioral analytics isn't just for fine-tuning marketing funnels; it’s also one of the sharpest tools in the shed for digital security. In the cybersecurity world, this specific application is called User and Entity Behavior Analytics (UEBA). At its heart, UEBA learns the typical digital rhythms of every user and system on a network so it can flag strange activity that might signal a threat.
Think of it like a security guard who has been on the job for years. They know every employee's routine by heart. If an employee who always clocks in at 9 AM suddenly tries to access a restricted server at 3 AM from halfway across the world, that guard is going to sound the alarm. UEBA does the same thing, just with digital fingerprints, by creating a baseline of what's considered "normal."

This kind of proactive monitoring is crucial for catching the sophisticated attacks that can easily sidestep older, rule-based security systems. While an antivirus program is busy looking for known viruses, UEBA is watching for suspicious actions.
Spotting Threats That Hide in Plain Sight
Traditional security tools are solid against known threats, but they often fall short when an attacker uses legitimate credentials to gain access. This is where behavioral analytics really shines, helping to pinpoint:
- Insider Threats: Imagine an employee with proper security clearance suddenly starts downloading huge volumes of sensitive files they've never accessed before. This could be a red flag for data theft.
- Compromised Accounts: A user's account might abruptly show activity that just doesn't add up, like logging in from two different continents within the same hour.
- Credential Fraud: When a hacker uses stolen login details, their actions will almost certainly differ from the real user's typical behavior, triggering an alert when those actions don't match the established pattern.
By zeroing in on deviations from the norm, UEBA can spot threats that don't involve any malware at all. It's all about answering one simple question: "Is this user acting like themselves?" That's a powerful layer of modern defense.
The growing importance of this approach is backed up by some serious numbers. The behavior analytics market, currently valued at USD 1.5 billion, is expected to skyrocket to USD 20.6 billion by 2035. This incredible growth is fueled by the pressing need to combat insider threats and credential-based attacks that leave conventional security measures in the dust. You can dig deeper into these projections in the behavior analytics market on researchnester.com.
Ultimately, when you ask what is behavioral analytics in a security context, you see just how versatile it is. It's a smart, dynamic way to protect a company's most important assets—its data and its customers' trust—by catching unusual behavior before it can turn into a full-blown crisis.
How to Get Started with Behavioral Analytics
Putting behavioral analytics into practice doesn't have to be some massive, intimidating overhaul. The secret is to start small and stay focused. Instead of trying to boil the ocean by analyzing everything at once, pick a single, concrete business goal. This gives your analysis a clear purpose from day one.
For example, a great starting point is setting a specific, measurable target like, "reduce new user drop-off by 20%." Right away, this goal sharpens your focus, telling you exactly where to look: the onboarding journey.
With your goal locked in, it's time to pick the right tools. The market for these platforms is booming, which tells you just how valuable this data has become. The global behavior analytics market was valued at USD 4.13 billion and is on track to hit USD 16.68 billion by 2030, with things like fraud detection pushing that growth. You can dig into the numbers yourself and read more about the growth of the behavior analytics market on grandviewresearch.com.
Creating Your Initial Strategy
Once you have your tools, you need a solid data tracking plan. Think of this as your roadmap. It spells out exactly which user actions—or "events," in analytics lingo—are actually meaningful for the goal you're trying to achieve.
- Map the User Journey: First, chart out the ideal path a user takes to reach their "aha!" moment. For our onboarding example, this might look like:
Account Created→Profile Setup→First Key Action. - Identify Key Events: Within that journey, pinpoint the most critical actions. Resist the urge to track every single click. Instead, focus on the events that truly signal progress or show you where the friction is.
- Start Small and Iterate: Don't get overwhelmed by trying to analyze every possible user path. Begin with that one, high-impact journey you just mapped out.
The whole idea is to translate your business goal into a series of trackable user actions. This turns a vague objective into a clear, data-driven investigation.
After you've collected some initial data, the real fun begins: interpreting what you see. Look for where users are getting stuck, veering off the ideal path, or dropping out completely. Form a hypothesis about why it's happening, then run A/B tests or other experiments to see if you're right. This kicks off a continuous cycle of improvement, turning your initial question into real insights that make the user experience better and push your business forward.
Still Have Questions? Let's Clear Things Up
Got a few more questions rattling around about behavioral analytics and how it all works? No problem. Here are some straightforward answers to the questions we hear most often.
How Is Behavioral Analytics Different From Business Intelligence?
Think of it this way: Business Intelligence (BI) is like looking in the rearview mirror. It’s fantastic for reporting on what’s already happened—your sales last quarter, your top-performing products, historical trends. It gives you the "what."
Behavioral analytics, on the other hand, is like looking at a GPS that predicts your arrival time based on current traffic. It digs into the "why" behind the numbers by analyzing user actions in real-time to forecast what they’ll do next.
Is This Too Complicated For A Small Business To Set Up?
Not at all. A few years ago, you might have needed a whole data science team, but today's tools have really leveled the playing field for businesses of any size. The secret is to avoid boiling the ocean.
Don't try to track every single click from day one. Instead, pick one specific goal, like figuring out why users abandon their carts. Focus only on the events in that customer journey, analyze that single path, and you'll get clear, actionable insights without the overwhelm.
Can You Even Use Behavioral Analytics Ethically?
Absolutely, and you should. Ethical usage comes down to one simple idea: using data to help your customers, not to manipulate them.
It’s all about transparency. Be clear in your privacy policy about what you’re tracking and why. The goal should always be to use the insights you gather to create a smoother, more helpful experience—like removing a frustrating step in your checkout process or making a feature easier to find. When you use data to solve real customer problems, everyone wins.
Ready to turn your customer insights into a powerful loyalty engine? Toki is an all-in-one platform designed to help you understand what your customers do and keep them coming back. Learn more about building customer loyalty with Toki and get started today.