A Guide to Customer Behavior Analytics
Unlock business growth with customer behavior analytics. Learn to analyze customer actions, use the right tools, and build strategies that drive loyalty.
Customer behavior analytics is all about piecing together the complete story of how customers interact with your brand. Think of it as your business's GPS for navigating customer actions. It turns clicks, scrolls, and purchases into a clear map of what your audience truly wants and needs.
Why Customer Behavior Analytics Matters Now
Running a business without understanding your customers is like trying to solve a puzzle with half the pieces missing. You might see what they buy, but you won't know why they bought it, what they almost chose instead, or what made them abandon their cart. This is where customer behavior analytics becomes a game-changer.
It’s no longer enough to just have a great product. Real success now hinges on delivering personalized experiences that make customers feel seen and understood. In our hyper-connected world, consumer behavior analysis is fundamental. It's like being a digital detective, piecing together clues to understand the entire customer journey.
From Optional to Essential
Not too long ago, this kind of deep-dive analysis was a luxury few could afford. Today, it’s a core business function. The reason for this shift is simple: data. Customers leave a trail of behavioral data everywhere they go—on your website, social media, emails, and even in physical stores.
To understand how central this has become, just look at the numbers. The global customer analytics market was valued at $11.88 billion in 2024 and is expected to rocket to $28.82 billion by 2029. This isn't just a trend; it's a fundamental shift driven by the need for smarter, data-backed decisions in a fiercely competitive market. And it's not just a big-business game anymore; companies of all sizes are using these insights to get ahead.
What You Can Achieve with Behavior Analytics
By digging into how customers interact with your brand, you can finally move from guesswork to informed strategy. This data-driven approach lets you:
- Boost Personalization: Go way beyond just using a customer's first name in an email. Imagine recommending products based on their recent browsing history, offering a timely discount on an item they left in their cart, or creating content that speaks directly to their needs.
- Improve Customer Retention: We've all heard it's cheaper to keep a customer than find a new one. Analytics helps you spot customers who might be about to leave by flagging changes in their behavior, giving you a chance to step in and re-engage them before they're gone.
- Optimize the Customer Journey: Pinpoint exactly where users are getting stuck. Is your checkout process clunky and causing people to drop off? Is a killer feature on your app buried and hard to find? Analytics shines a light on these friction points so you can fix them.
Ultimately, customer behavior analytics is about closing the gap between what you think your customers want and what their actions show they actually want. That deeper understanding is the bedrock for building genuine, long-lasting relationships that fuel loyalty and growth.
What Customer Behavior Metrics Actually Tell You
Metrics aren't just numbers on a dashboard; they’re the language your customers use to tell you what they think and feel. Good customer behavior analytics is all about learning to speak that language fluently. It’s about getting past the raw data to uncover the real story hiding underneath.
Think of yourself as a detective. A single clue rarely solves the mystery. It’s only when you start connecting multiple clues that the full picture of the customer’s experience comes into focus.
Going Deeper Than the Obvious
Let’s talk about a classic metric: session duration. On the surface, a long session looks like a big win—someone is clearly engaged, right? But it could just as easily mean they're completely lost, clicking in circles, and getting more frustrated by the second. The number alone doesn't tell you which story is true.
The same goes for bounce rate, which tracks when someone leaves your site after looking at just one page. A low bounce rate is usually considered a good thing. But what if that single page has your business's phone number on it? A visitor could land on the page, grab the number, make a call, and leave—a "bounce" that was actually a total success. Context is everything.
The real magic of customer behavior analytics isn't in tracking metrics in isolation. It’s in understanding how they weave together to tell the complete customer story. A long session combined with several page views probably signals engagement. But that same session duration paired with repetitive, circular navigation? That screams frustration.
This is exactly why you have to look at how different data points relate to each other to get an accurate read on things.
Core Metrics and the Stories They Tell
To really get what your customers are doing, you need to look at clusters of metrics that, together, paint a much clearer picture. Here are a few of the most important ones and what they can reveal when you look at them together.
- Conversion Rate: This is the percentage of visitors who do what you want them to, like buying something. A high conversion rate is fantastic, but it's more powerful when you know who is converting. Are they first-time visitors or loyal, returning customers? The answer changes your strategy.
- Customer Lifetime Value (CLV): This number predicts the total amount of money you can expect to earn from a single customer over their entire relationship with you. A steadily rising CLV is one of the best signs of a healthy business built on customer loyalty.
- Churn Rate: This tells you the percentage of customers who walk away during a certain period. If you see a sudden spike in churn right after a website redesign, you likely have a major user experience problem that needs to be fixed, fast.
- Average Order Value (AOV): AOV tracks how much the average customer spends per order. When you analyze this alongside what products people tend to buy together, you can come up with smarter product bundles and upselling tactics.
You can also uncover valuable insights from payment method data, which shows you how different customer groups prefer to pay. This can be a goldmine for improving your checkout flow or planning how to expand into new markets.
Let's Walk Through an Example
Imagine an online store is struggling with a high cart abandonment rate. That single metric is the first clue.
- The First Clue: The analytics team sees that a staggering 70% of users who add items to their cart are leaving without buying.
- Digging Deeper: They start watching session recordings and notice a pattern: users consistently pause and hesitate when they get to the shipping page.
- Connecting the Dots: The team then cross-references this with feedback from customer surveys, which confirms their suspicion. The number one complaint? Unexpectedly high shipping costs.
- The Solution: The store acts on this insight by adding a shipping cost calculator much earlier in the checkout process, so there are no surprises.
The result? The cart abandonment rate plummets, and the overall conversion rate ticks up. This is customer behavior analytics in action—not just seeing what is happening, but understanding why so you can make confident, effective changes. When you combine the hard numbers with real human insights, you start solving real problems and building a smarter business.
Choosing Your Customer Analytics Toolkit
To really get a complete picture of your customers, you need more than just one piece of software. It’s a lot like a mechanic’s workshop. You wouldn't use a hammer to change a tire or a wrench to paint a car; you need a whole collection of specialized tools for specific jobs. The same idea applies here. Building the right tech stack is the key to turning raw data into insights you can actually use.
The market for these tools is huge, and it can feel a little overwhelming at first. The good news is that they generally fall into a few key categories. By combining the right ones, you can finally move beyond just seeing what customers do and start understanding why they do it.
Foundational Web and Product Analytics
This is your starting point—the wide-angle lens for your website or app. Think of these tools as the masters of quantitative data, answering the "what," "how many," and "when" of user actions. They’re brilliant at tracking things like traffic sources, page views, how long people stick around, and broad conversion events.
For instance, a web analytics platform might tell you that 5,000 users hit your new landing page last week, and 30% of them arrived from a particular social media campaign. This high-level data is essential for checking the pulse of your digital channels and seeing how your marketing is performing.
While a tool like Google Analytics is a common go-to, it’s always smart to check out some alternative analytics tools that might be a better fit for what you need. The goal is to find a platform that clearly shows you the flow of traffic and gives you a solid baseline of user engagement.
Qualitative Behavior Analysis Tools
So, your web analytics told you what happened. Now you need to figure out why. This is where qualitative tools come in, adding the human context that raw numbers just can't provide.
- Session Replay Tools: These platforms let you watch anonymized recordings of actual user sessions. It’s like looking over their shoulder. Seeing exactly where someone hesitated, got confused, or struggled before ditching their cart is so much more insightful than just seeing a high cart abandonment rate.
- Heatmaps: These give you a visual snapshot of user attention. Using simple color gradients, they show you precisely where people click, scroll, and move their cursors. You can instantly spot which buttons are being ignored or which parts of your content are grabbing the most eyeballs.
Imagine a heatmap shows that your main call-to-action button—the one you thought was perfectly placed—is getting zero clicks. That's a crystal-clear sign that something in your design needs fixing, an insight you’d never get from a standard report.
By combining a session replay with a heatmap, you can see not only that users aren't clicking a button but also watch them scroll right past it, highlighting a potential visibility issue.
Unifying the Data with CDPs
Having all your data stuck in different places—web analytics over here, sales data over there—makes it impossible to see the whole story. This is the problem that Customer Data Platforms (CDPs) were built to solve. Think of a CDP as the central hub for every piece of customer data you have.
It pulls in information from every touchpoint, from your website and mobile app to your CRM and even in-store sales systems. Then, it cleans, organizes, and stitches all that data together to create a single, unified profile for every customer. This unified view is the holy grail of customer behavior analytics.
With a CDP like Toki, you can finally connect all the dots. You can see that the customer who just browsed a product category online is the same person who bought something in-store last month and recently redeemed a loyalty reward. This is the kind of deep understanding that lets you create truly personal experiences and build loyalty that lasts.
Mapping The Entire Customer Journey
A customer’s relationship with your brand is never just a single, isolated event. It’s a journey with a beginning, a middle, and—if you play your cards right—no end. Customer behavior analytics is all about mapping this entire path, from the first time someone hears about you to the moment they become a loyal advocate.
When you connect all these touchpoints, you stop seeing customer interactions as random data points. Instead, you start seeing the complete story. This narrative shows you exactly where customers are thriving, where they’re getting stuck, and where your biggest opportunities lie to create a smoother, more enjoyable experience.
This isn’t just a nice-to-have; it’s a massive business driver. The global customer journey analytics market, valued at USD 17.91 billion in 2025, is projected to soar to an incredible USD 47.06 billion by 2032. This explosive growth shows just how seriously businesses are shifting their focus from one-off transactions to building lasting relationships.
Breaking Down The Journey Stages
To really get a handle on this, it helps to break the journey down into four classic stages. At each point, specific behaviors give you clues about what a customer is thinking and what they need from you. Tracking these actions helps you understand where they are in the process so you can tailor your approach.
1. Awareness Stage
This is square one, where a potential customer first discovers your brand. They aren't ready to buy just yet; they're simply figuring out who you are and what you're all about.
- Key Question: How did they find us?
- Behaviors to Track:
- Traffic Source: Did they find you through an organic search, a social media ad, or a link from another site? This tells you which of your marketing channels are actually working.
- Landing Page Engagement: Are they bouncing right away, or do they stick around for a few moments to read your headlines and see what’s on the page?
2. Consideration Stage
Okay, now they know they have a problem to solve or a desire to fulfill, and they’re actively trying to figure out if your product is the right solution. They’re comparing, researching, and digging deeper.
- Key Question: Are we giving them the info they need to make a choice?
- Behaviors to Track:
- Product Page Views: Which specific items are catching their eye? How many different products do they check out in a single visit?
- Content Consumption: Are they reading your blog, watching demo videos, or scrolling through customer reviews? This signals genuine interest.
- "Add to Cart" Actions: This is a big one. Even if they don't complete the purchase, adding an item to their cart is a strong signal of intent.
The image below shows how different analysis techniques can be applied at each stage to get a clearer picture of what your customers are doing.
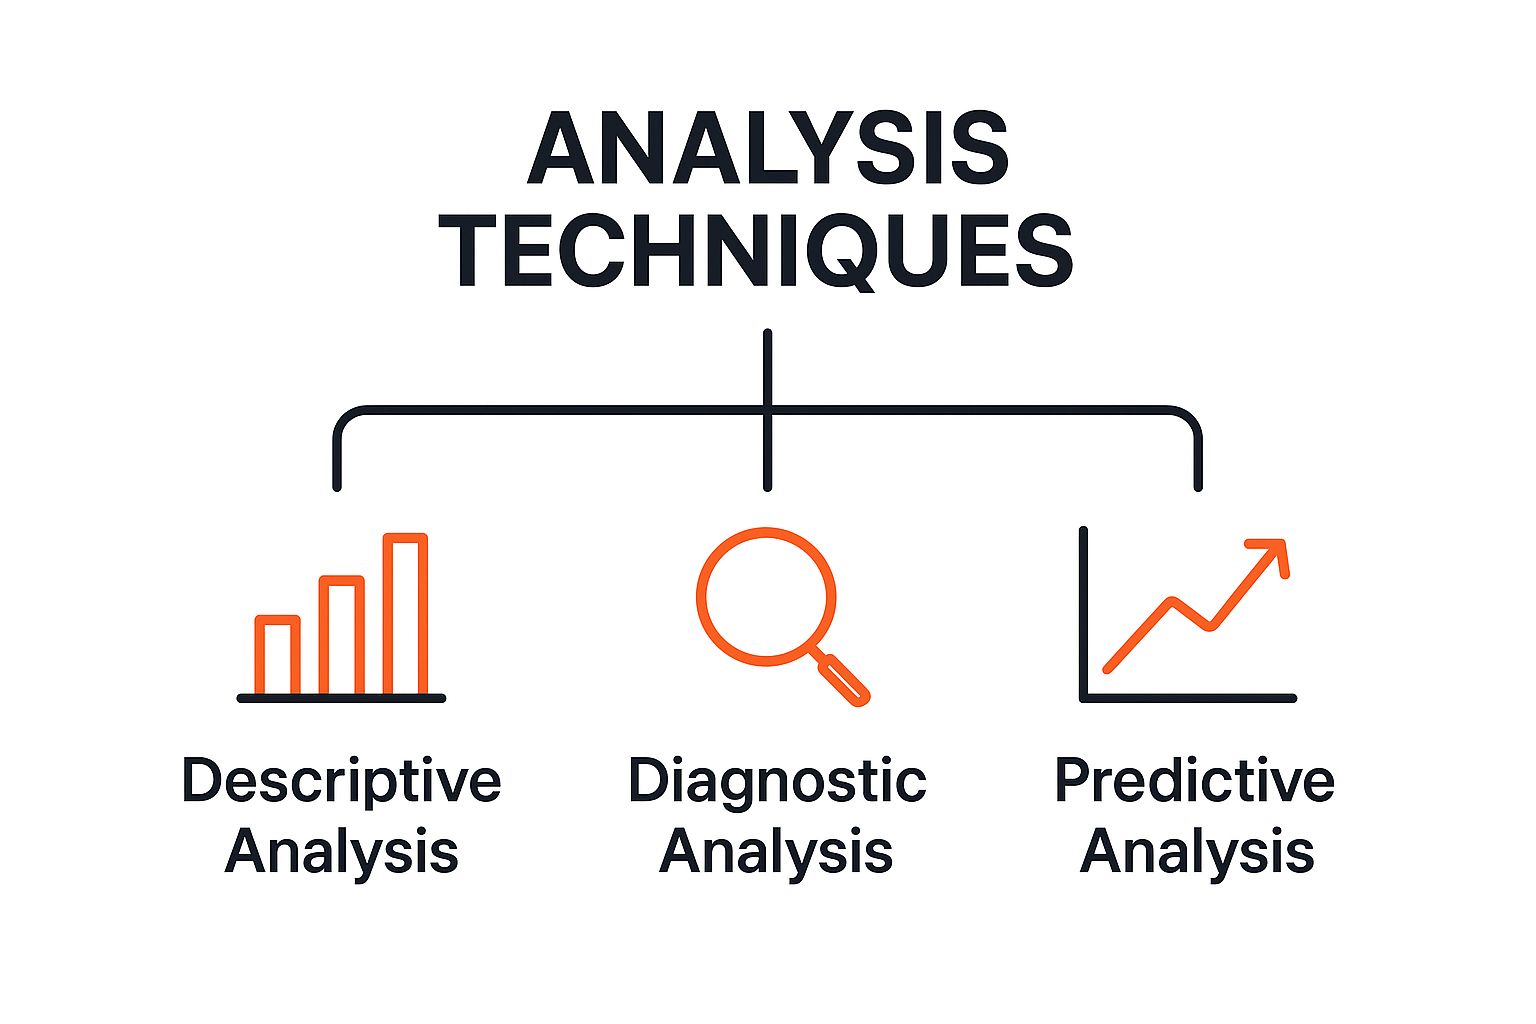
As you can see, descriptive, diagnostic, and predictive analytics all work together, helping you build a comprehensive understanding of the customer journey from start to finish.
3. Purchase Stage
This is the moment of truth, where a curious browser turns into a paying customer. The goal here is simple: make the transaction as easy and painless as possible.
- Key Question: What might stop them from finishing the purchase?
- Behaviors to Track:
- Checkout Funnel Drop-off: Where exactly are people abandoning the checkout process? Is it the shipping page? The payment step? Or when you ask them to create an account?
- Promo Code Usage: Are customers actively looking for and using discounts? This can tell you a lot about your pricing and promotional strategy.
4. Retention Stage
The journey doesn't end once the purchase is made—in many ways, it's just beginning. The goal now is to turn that one-time buyer into a repeat customer and, ultimately, a true fan of your brand. If you want to go deeper on this, check out our complete guide on customer journey optimization.
- Key Question: Are they coming back, and what’s bringing them back?
- Behaviors to Track:
- Repeat Purchase Rate: What percentage of your customers buy from you more than once?
- Time Between Purchases: What’s the average gap between a customer's first and second purchase? Knowing this helps you time your re-engagement campaigns perfectly.
- Loyalty Program Engagement: Are they earning and redeeming points? With a tool like Toki, you can see exactly how they interact with your loyalty system.
By connecting behaviors across all four stages, you can build a powerful, data-driven map of your customer's entire experience and uncover the path to lasting loyalty.
Real-World Wins with Behavior Analytics
Theory is one thing, but seeing how it all works in practice is what really matters. This is where we get to see customer behavior analytics flex its muscles, turning abstract data into real wins for businesses. We're moving past the dashboards and digging into stories of how companies have unlocked insights that boost revenue, keep customers happy, and create a truly better experience.
The buzz around this field isn't just hype. The global behavior analytics market is projected to skyrocket from USD 1.10 billion to a staggering USD 10.80 billion by 2032. This explosive growth shows just how seriously businesses are taking behavioral data to get ahead of customer needs and make smarter moves. You can see the full breakdown in the latest behavior analytics market research.
But these aren't just big numbers on a chart; they represent thousands of businesses getting tangible results. Let’s look at a couple of examples.
E-Commerce Checkout Optimization
Cart abandonment. It’s the bane of every online store's existence. One clothing retailer was watching in horror as 75% of their customers bailed at the final step of checkout. They knew what was happening, but the why was a complete mystery.
- The Challenge: Pinpoint the exact reason customers were getting cold feet and leaving without buying.
- The Method: The team turned to session replays and heatmaps. The heatmaps immediately showed that the "Complete Purchase" button was getting ignored. Watching the session replays revealed the full story: customers were frantically scrolling up and down the page, clearly confused or looking for something.
- The Insight: The villain was a last-minute surprise: unexpected shipping costs. This hidden fee, revealed only at the very end, was creating sticker shock and eroding trust.
- The Outcome: The fix was simple but powerful. They moved the shipping calculator to the start of the checkout process. No more nasty surprises. The result? Cart abandonment plummeted by 30%, and conversions shot up by 12% in just one quarter.
SaaS Feature Adoption and Churn Prevention
For any SaaS business, churn is public enemy number one. A project management platform noticed a disturbing trend—a huge chunk of new users were canceling their subscriptions within the first month.
“Customers vote with their behavior, and you have to be able to react to that quickly and not put your own preferences and bias ahead of what the customers are actually telling you.”
That quote perfectly captures the mindset needed here. Instead of just relying on exit surveys, they dove into the behavioral data of customers who stayed versus those who left.
- The Challenge: Figure out what successful users were doing differently and use that knowledge to stop others from leaving.
- The Method: They used product analytics to track which features were being used. By segmenting their user base, they could compare the behavior of their power users against those who quickly churned.
- The Insight: The data couldn't have been clearer. Users who created and shared at least three projects with teammates in their first week had a 90% retention rate. Those who didn't were almost guaranteed to cancel. The "aha!" moment was all about collaboration.
- The Outcome: With this insight in hand, they overhauled their onboarding process completely. The new flow guided users to create and share a project right away. They also added in-app prompts to encourage teamwork, which led to a 25% drop in first-month churn. This kind of early engagement is also a cornerstone of successful loyalty programs, a connection you can explore further in our guide to loyalty program analytics.
Turning Behavioral Insights Into Customer Loyalty
All this data collection and analysis isn't just an academic exercise. The real goal is to earn genuine customer loyalty. This is where customer behavior analytics shifts from a simple diagnostic tool to a powerful engine for building relationships. It’s that final, crucial step where raw insights become real action, transforming one-time buyers into lifelong brand advocates.
Think of your behavioral data as a blueprint for building a bridge directly to your customers. Every click, purchase, and interaction is a puzzle piece showing you exactly what they value. When you piece it all together, you can create experiences so personal that customers feel truly seen and appreciated—and that’s the bedrock of lasting loyalty.
It’s not just a hunch, either. One study found that 49% of customers flat-out expect to be recognized for their loyalty. Using analytics to spot and reward these valuable customers isn't just good service; it's a fundamental retention strategy. This is how data stops being about transactions and starts being about people.
From Data to Devotion: A Practical Framework
Turning analytics into loyalty doesn’t just happen. It takes a clear, step-by-step approach that connects what you know about your customers to how you treat them. Here's how to make your data work for you.
1. Segment Customers by Behavior First things first, group your customers based on what they do, not just who they are. This is far more powerful than relying on demographics alone. You can create practical segments like:
- Brand Champions: Your most frequent buyers who actively engage with your loyalty program.
- At-Risk Customers: People whose time between purchases is getting longer or who've stopped opening your emails.
- Bargain Hunters: Shoppers who only buy when there’s a big sale or they have a discount code.
- Newcomers: First-time buyers who are still in their first 30 days.
2. Personalize Rewards and Offers With these segments in hand, you can finally ditch the one-size-fits-all promotions. Send an exclusive early-access offer to your Brand Champions. Target your At-Risk Customers with a special "we miss you" bonus point offer. This kind of personalization shows you’re actually paying attention.
The best loyalty strategies feel less like a marketing tactic and more like a genuine thank you. Behavioral data lets you customize that 'thank you' so it lands perfectly with each customer group.
3. Test and Refine Your Strategy Use A/B testing to figure out what really moves the needle for each segment. Do your Bargain Hunters respond better to free shipping or a percentage-off discount? Do your Newcomers engage more with bonus points or helpful content about your products?
By constantly testing and digging into the results, you can fine-tune your loyalty program for maximum impact. If you're using a platform like Toki, this whole process becomes much simpler since you can track engagement with different rewards directly. A big part of this is knowing what to measure, and you can learn more by exploring how to measure the success of a loyalty program in our guide. This continuous cycle of analysis and refinement is what builds a truly resilient and effective retention machine.
A Few Common Questions
As you start thinking about how to apply these ideas, a few questions usually pop up. Let's walk through some of the most common ones people ask when getting started with customer behavior analytics.
How Can a Small Business Start Without a Huge Budget?
You definitely don’t need a massive budget to get going. The trick is to be resourceful. Start by mastering the free tools you already have access to. A platform like Google Analytics is fantastic for getting a handle on the basic numbers—where your traffic comes from, how many people leave right away (bounce rate), and if they're completing key actions. This gives you a solid quantitative foundation.
Then, for the 'why' behind the numbers, look for session replay and heatmap tools that have generous free tiers. These plans might limit how many user sessions you can record each month, but even watching a small handful can expose glaring issues on your site. You might spot a broken button or a confusing checkout step in minutes. The key is to start small and focus on quick wins that deliver a big impact.
What’s the Difference Between Behavior Analytics and Web Analytics?
This is a great question because the two are often confused, but they serve very different purposes.
Think of it this way: traditional web analytics tells you what happened. It's the box score of your website—how many visitors came, which pages they looked at, and how much time they spent. It’s the raw data.
Customer behavior analytics tells you why it happened. It adds the human story to the data. By using tools like session replays and heatmaps, you can see where users get stuck, what frustrates them, and what motivates their clicks.
One reports on traffic and numbers; the other reveals the actual experience.
How Do I Handle Customer Data Ethically?
Handling data ethically isn't just a legal requirement; it's the bedrock of customer trust. The most important principle is transparency. Your privacy policy should clearly and simply explain what data you're collecting and exactly why you need it.
Always anonymize personal data wherever possible, especially in session recordings, to protect user identities. Make sure you’re compliant with regulations like GDPR, which are designed to give users control over their information. A good rule of thumb is to only collect the data you absolutely need to make the customer's experience better. This minimalist approach not only ensures compliance but also proves to your customers that you respect their privacy—a huge factor in building real, lasting loyalty.
Ready to turn those behavioral insights into customers who keep coming back? Toki gives you everything you need in one platform to build a compelling loyalty and rewards program. Start deepening those customer relationships and driving repeat sales. Get started with Toki today.