How to Calculate Customer Retention Rate for Your Ecommerce Store
Learn how to calculate customer retention rate with our practical guide for ecommerce brands. Use our formula, real examples, and tips to boost loyalty.
Before we jump into the formulas and spreadsheets, let's talk about why customer retention is one of the most powerful metrics for your business. It's easy to get caught up in the chase for new customers, but the real, sustainable growth often comes from the people who already know and trust you.
Think of it this way: your customer retention rate is a direct reflection of how happy your customers are. It’s the percentage of customers who stick with you over a specific period, and it’s a powerful indicator of your brand's health.
The formula itself is pretty straightforward: ((Customers at End of Period - New Customers) / Customers at Start of Period) x 100.
We'll break down exactly how to use that in a bit, but first, let's unpack why this number is so crucial.
Why Customer Retention Is Your Real Growth Engine
While flashy acquisition campaigns grab the headlines, focusing on retention is what builds a predictable and profitable business. It’s about turning one-time buyers into loyal fans who contribute to your bottom line again and again.
When you nail retention, you're not just maintaining a number—you're increasing the lifetime value (CLV) of every customer. They already trust your brand and understand your products, which makes them far more likely to make repeat purchases without needing a big marketing push.
The Financial Power of Loyalty
From a purely financial standpoint, prioritizing retention is a no-brainer. Acquiring a new customer can cost anywhere from five to 25 times more than keeping an existing one. That’s a huge difference. Every customer you keep is money saved on ad spend that you can pour back into improving your products or customer experience.
Your Customer Retention Rate (CRR) is more than just a metric; it's a report card on key parts of your business:
- Customer Experience: A high CRR suggests your checkout, shipping, and support are all hitting the mark.
- Product Quality: It validates that your products are delivering on their promises and solving real problems.
- Brand Strength: It shows you've built a genuine connection that goes beyond a simple transaction.
The impact of even small improvements can be staggering. Research shows that 80% of future profits will likely come from just 20% of your existing customers. For businesses that create a seamless omni-channel experience, a tiny 1% bump in retention can boost profits by 5-10%.
To really see why this matters, it helps to compare the two growth strategies side-by-side.
Customer Retention vs Customer Acquisition At a Glance
Here’s a quick breakdown of how these two approaches impact your business differently. While both are necessary, you can see where retention provides more long-term, sustainable value.
| Metric | Customer Retention Focus | Customer Acquisition Focus |
|---|---|---|
| Cost | Significantly lower (5-25x cheaper) | High upfront investment in ads & marketing |
| Conversion Rate | High (60-70% probability of selling) | Low (5-20% probability of selling) |
| Profitability | Higher profit margins per customer | Lower initial profitability due to high costs |
| Long-Term Value | Builds high Customer Lifetime Value (CLV) | Focuses on the initial transaction |
| Brand Loyalty | Creates brand advocates and referrals | Builds brand awareness, not necessarily loyalty |
| Growth Strategy | Sustainable, compound growth | Linear, resource-intensive growth |
This table makes it clear: acquisition fills the top of your funnel, but retention is what keeps the engine running smoothly and profitably.
Ultimately, a strong retention rate is a sign that you're delivering real value. Understanding the core differences between these two strategies is fundamental, and you can explore this further in our detailed guide on customer retention vs. customer acquisition.
The Core Formula for Calculating Customer Retention
Before you can improve customer loyalty, you need a way to measure it. Luckily, figuring out your Customer Retention Rate (CRR) isn't as complicated as it sounds, and you definitely don't need a Ph.D. in statistics to do it.
The go-to formula gives you a clear percentage of how many customers stuck with you over a set period.
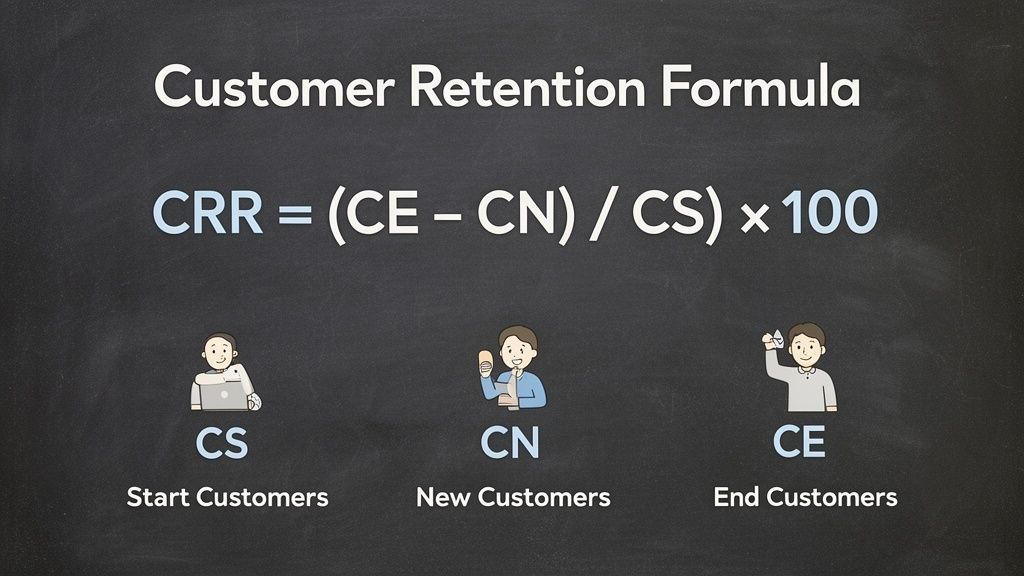
It looks like this: CRR = [ (CE - CN) / CS ] x 100
I know, formulas can look a bit intimidating at first. Let's break down what each of those letters actually means in the real world.
Breaking Down the Variables
To really get a handle on how to calculate customer retention rate, you just need to pull three simple numbers from your sales or customer database.
- CS (Customers at the Start): This one's easy. It's the total number of customers you had on day one of the period you're measuring.
- CE (Customers at the End): This is your total customer count on the final day of that same period.
- CN (New Customers Acquired): This is the number of brand-new customers you brought in during that timeframe.
The key part of this calculation is subtracting your new customers (CN) from your total customers at the end (CE). Why? Because we want to isolate the people who were already with you and made a conscious choice to stay.
A Practical Example from an Online Store
Let's put this into practice. Say you run an online store that sells handmade candles, and you want to see how you did in April.
First, you pull the numbers for the month:
- You started April with 1,000 customers (CS = 1,000).
- You ran a great campaign and signed up 150 new shoppers (CN = 150).
- By April 30th, your total customer count was 1,020 (CE = 1,020).
Now, we just pop those numbers into the formula.
- First, isolate the retained customers: 1,020 (CE) - 150 (CN) = 870
- Next, divide that by your starting number: 870 / 1,000 (CS) = 0.87
- Finally, turn it into a percentage: 0.87 x 100 = 87%
Boom. Your customer retention rate for April is 87%. This tells you that nearly nine out of ten of your original customers were still with you a month later. Getting comfortable with key metrics like this is a game-changer. In the same way, learning how to calculate marketing ROI helps you see the bigger picture of your business's financial health.
Key Takeaway: Always subtract the new customers you gained during the period. It's the most common mistake people make, and it will seriously inflate your numbers, giving you a false sense of security about customer loyalty.
The timeframe you choose—weekly, monthly, quarterly—really depends on your business. For a subscription service, quarterly might be perfect. For a fast-paced ecommerce brand, I find that a monthly calculation usually hits the sweet spot, providing timely insights without getting bogged down by daily noise.
Putting Your Calculation into Practice with Everyday Tools
The great thing about the customer retention formula is its simplicity. You don't need a fancy business intelligence platform to get started. In fact, the tools you already use every day are more than capable of handling this.
Let's walk through how to crunch the numbers using a basic spreadsheet and then a more direct database query. The goal here is to get you from theory to a practical, repeatable process you can start using today, no matter your tech-savviness.
Calculating Retention with a Spreadsheet
For most business owners I talk to, a simple Google Sheet or Excel file is the perfect place to start. It’s visual, easy to update, and doesn’t require any special skills.
Here’s a straightforward way to set it up:
-
Create Your Columns: Lay out your sheet with columns for
Month,Starting Customers (CS),New Customers (CN),Ending Customers (CE), andRetention Rate (CRR). -
Plug in Your Data: At the end of each month, you'll just need to fill in the first three data points. Your accounting software or e-commerce platform dashboard should have these numbers handy.
-
Add the Formula: In your
Retention Rate (CRR)column, enter the formula. For a spreadsheet, it would look something like this:=((D2-C2)/B2)*100.
This simple setup gives you a clear, month-over-month view of how you're doing. I highly recommend adding a basic chart to visualize the trend over time—it makes it much easier to spot improvements or flag potential issues at a glance.
My Two Cents: Don't just calculate it once. Keep a running log. The real magic happens when you see your retention rate trend over several months or quarters. A single month is just a snapshot; a full year tells a powerful story about your customer loyalty.
Using SQL for a Direct Calculation
If your customer data lives in a database and you're comfortable with SQL, you can pull these numbers much more directly. This method is fantastic for automating the process, especially if you want to pipe the data into a dashboard.
While the exact query will depend on your database schema, the logic is always the same. Here’s a conceptual SQL query you could adapt for your own use:
WITH CustomerCounts AS ( SELECT COUNT(DISTINCT CASE WHEN created_at < '2023-04-01' THEN customer_id END) AS starting_customers, COUNT(DISTINCT CASE WHEN created_at >= '2023-04-01' AND created_at < '2023-05-01' THEN customer_id END) AS new_customers, COUNT(DISTINCT customer_id) AS ending_customers FROM customers WHERE created_at < '2023-05-01' ) SELECT ( (ending_customers - new_customers) * 100.0 / starting_customers ) AS retention_rate FROM CustomerCounts;
This query calculates all the necessary numbers for a specific period (April 2023, in this case) and spits out your retention rate directly.
Of course, many modern platforms are built to do this heavy lifting for you. Solutions like Toki, for example, often come with built-in analytics that show retention rates and other key loyalty metrics right on your dashboard, saving you the manual effort.
If you're curious about what's out there, you can learn more about the best ecommerce analytics tools available today. But whether you use a spreadsheet, SQL, or a dedicated platform, the most important thing is to just get started and track it consistently.
Uncovering Deeper Insights with Cohort Analysis
Getting a handle on the basic customer retention rate formula is a great first step. It gives you a vital, big-picture look at your business's health. But sometimes, that single, blended number can mask the real stories your data is trying to tell. To get to the good stuff, you need to dig a little deeper with cohort analysis.
So, what’s a cohort? Simply put, it's a group of customers who all share a common trait, most often the time they first became a customer. For example, everyone who made their first purchase in January belongs to the "January Cohort." Instead of lumping all your customers together, you track each of these specific groups over time to see how their behavior differs.
This method can completely change how you see your business. Your overall retention rate might look perfectly steady, but a cohort analysis could reveal that your newest customers are churning out way faster than your older ones. That’s a huge red flag, maybe pointing to a problem with a recent product update or a marketing campaign that’s not hitting the mark.
Segmenting Your Customer Base for Clarity
The real magic happens when you start segmenting. By grouping customers based on shared behaviors or characteristics, you can finally stop guessing what drives loyalty and start making decisions based on cold, hard facts.
Here are a few powerful ways I’ve seen merchants segment their customers:
- Acquisition Channel: Are the customers you acquire through Instagram ads sticking around longer than those who find you through your email list? Answering this tells you exactly where to put your marketing dollars for the best long-term value.
- First Product Purchased: Maybe you notice customers whose first purchase was your signature running shoe have incredible loyalty, while those who bought a promotional t-shirt rarely come back. This helps you identify which products are true gateways to your brand.
- Geographic Location: You might find that customers in a particular city have an unusually high retention rate. This could be a sign of a regional opportunity you can lean into with targeted campaigns.
By isolating these groups, you move from a general understanding to specific, actionable insights. You can identify your most valuable customer segments and figure out how to replicate that success across your entire customer base.
From Data to Smart Business Decisions
Ultimately, learning how to calculate customer retention rate with cohorts is about turning raw numbers into a smart, actionable strategy. In a tough e-commerce market where the average retention rate can hover around 38%, this level of precision is a massive advantage. For Shopify merchants especially, tracking cohort retention accurately is crucial for getting ahead of the competition.
If you want to go even deeper on this, check out our detailed guide on cohort analysis.
Different tools offer different levels of insight, from basic spreadsheets to more advanced dashboards that can automate this kind of analysis for you.
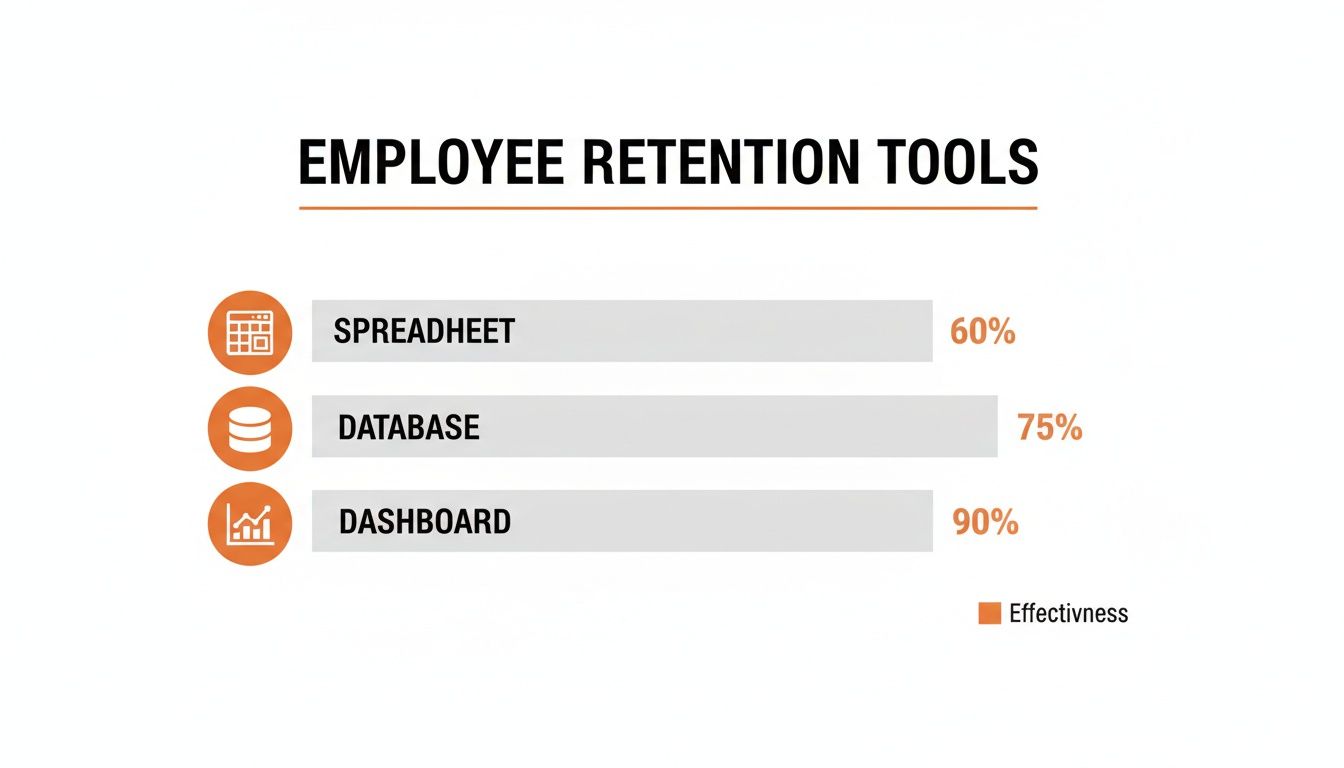
As you can see, while a spreadsheet gets the job done, dedicated dashboards give you a much clearer and more powerful view. This is key as your business grows. Platforms like Toki can help you turn these insights into loyalty-boosting actions that push your retention far beyond the industry average. Speaking of which, it's always good to know where you stand.
Customer Retention Rate Benchmarks by Industry
Knowing what a "good" retention rate looks like can be tricky because it varies so much. What’s fantastic for one industry might be cause for concern in another. This table gives you a general idea of average annual retention rates across different sectors to help you benchmark your own performance.
| Industry | Average Customer Retention Rate (%) |
|---|---|
| Retail | 63% |
| Banking | 75% |
| Telecom | 78% |
| IT Services | 81% |
| SaaS | 83% |
| Media | 84% |
| Professional Services | 84% |
| Insurance | 84% |
| Financial Services | 84% |
Source: Data compiled from various industry reports.
Don't be discouraged if your numbers aren't at the top of the chart. Instead, use these benchmarks as a starting point to set realistic goals and track your progress over time. The key is consistent improvement.
Don't Let These Common Mistakes Skew Your Retention Numbers
On the surface, calculating customer retention seems pretty straightforward. But I've seen a few common slip-ups time and time again that can seriously throw off your data. Getting this metric right is crucial—it guides your marketing budget, product roadmap, and overall growth strategy. Let's walk through how to avoid the most common pitfalls so you get an accurate read every single time.
Counting New Customers in Your Final Tally
This is probably the most frequent mistake I see. Remember, the whole point of measuring retention is to see how well you're holding onto the customers you already had. New customers acquired during the period don't belong in this calculation.
Including them will make your retention rate look much better than it actually is. It creates a dangerous blind spot, masking churn problems that might be bubbling just beneath the surface.
Think of it this way: if you end the quarter with 1,000 customers, but 200 of them are brand new, you can only have retained a maximum of 800 customers from your starting pool. Forgetting to subtract those new folks is the fastest way to get a number that feels good but tells you nothing about loyalty.
Using a Vague Definition of "Active Customer"
Another major pitfall is not having a crystal-clear, consistent definition of what makes a customer "active" or "retained." If your definition is fuzzy, your data will be, too. Does a single login count? What about one purchase in a year?
The answer really depends on your business model.
- For subscription businesses: This is usually simpler. An active customer is typically anyone with a paid, current subscription.
- For e-commerce or retail: This gets trickier. You have to define a reasonable purchasing window based on your product. For a shop selling coffee beans, an active customer might be someone who bought in the last 90 days. For a company selling high-end furniture, that window could easily be 18-24 months.
My Advice: Don't just pick a number out of thin air. Your "active" window should reflect your natural customer buying cycle. If your best customers tend to buy every 60 days, setting your active window to a full year will hide the fact that people are lapsing long before you notice.
Comparing Apples to Oranges with Time Periods
Finally, consistency with your timeframes is non-negotiable. You simply can't compare a quarterly retention rate from Q1 with a monthly rate from April. It’s like comparing two completely different datasets—the conclusions you draw will be flawed at best.
Pick a cadence that makes sense for your business—monthly, quarterly, or annually—and stick to it. This creates a reliable baseline and allows you to spot genuine trends over time.
Consistent, clean measurement is the foundation of any good retention strategy. By avoiding these common errors, you'll know that when you sit down to calculate your customer retention rate, the insights you uncover are both accurate and truly actionable.
Turning Your Retention Numbers Into Real Growth
Knowing your customer retention rate is one thing, but actually improving it is where the magic happens. Once you have that baseline number, you can start rolling out strategies that turn first-time buyers into genuine fans who come back again and again.
And the reason to focus here is simple: it’s incredibly profitable. Your existing customers are not only far more likely to buy from you—with a 60-70% chance of an upsell versus just 5-20% for new prospects—but they also spend 67% more on average. It's no surprise that 59% of sales leaders point to loyalty programs as their most effective strategy for making this happen.
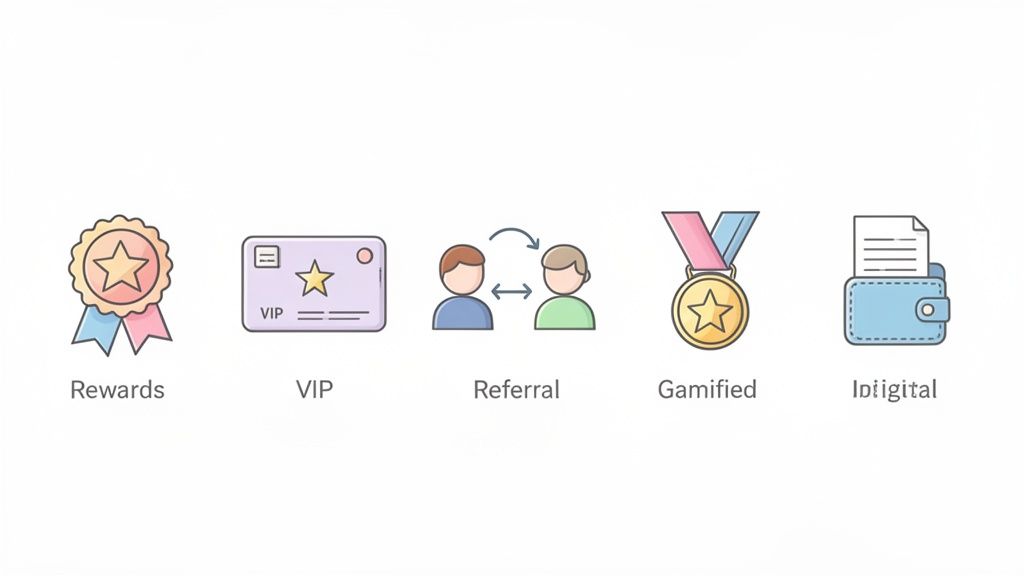
Start with a Simple Points-Based Rewards Program
One of the easiest wins for boosting retention is a classic points-based system. It’s a straightforward deal: customers spend money, they earn points, and they can cash those points in for discounts or freebies. This gives them a concrete reason to choose you over a competitor next time they need something you sell.
The key is to keep it simple. For instance, offering 10 points for every dollar spent is easy to understand. When a customer hits 500 points, they can redeem them for a $5 coupon. A platform like Toki can handle all the backend work, making the whole experience feel like a natural part of shopping with you.
Build an Exclusive Community with VIP Tiers
People love feeling like they're on the inside. A tiered membership program takes this idea and runs with it, offering better and better perks as customers spend more. It creates a sense of achievement and exclusivity that can foster a much deeper connection to your brand.
A simple tier structure could look something like this:
- Bronze Tier: The entry point. Think birthday bonuses or a small welcome gift.
- Silver Tier: For customers who hit a certain spending threshold. Maybe this unlocks perks like free shipping.
- Gold Tier: For your top spenders. This is where you can offer exclusive access to new products or special events.
A well-designed VIP program isn't just about rewarding purchases; it's about building a community. When you offer experiences and perks that money can't buy, you give your best customers a compelling reason to stick around.
Of course, retention starts with a great first experience. Making sure customers can easily find your products in the first place is crucial. For example, if you sell on major marketplaces, investing in Amazon SEO services can ensure you're visible from the start, setting the stage for long-term loyalty.
Let Your Best Customers Do the Marketing for You
Your most passionate customers are your most powerful marketing asset. A referral program gives them a real incentive to tell their friends about you, transforming their natural enthusiasm into a steady stream of new business.
The classic "give a friend $10, get $10" model works so well because it's a win-win. The new customer gets a discount, and your loyal customer gets a reward for their advocacy. It's a powerful form of social proof that advertising just can't replicate.
These aren't just abstract ideas—they are proven, practical tools you can implement right away. By connecting them to the retention numbers you've just learned how to calculate, you can actively drive growth instead of just passively measuring it.
Ready to put these strategies into play? With Toki, you can launch customizable rewards, VIP tiers, and referral programs in just a few minutes. Start building a loyal community and drive more repeat sales today. Explore all the features at https://buildwithtoki.com.