Mastering Your Customer Retention Metric
Unlock business growth by mastering your customer retention metric. Learn to calculate and improve key metrics that drive sustainable loyalty and revenue.
A customer retention metric is really just a number—a KPI—that tells you how good your company is at keeping customers around. Think of it as a scorecard for loyalty and satisfaction, showing you how well you’re taking care of the relationships you’ve already built.
Why Retention Is Your True Growth Engine

It’s easy to get caught up in the chase for new customers. It feels like progress, right? But the real secret to long-term, sustainable growth is right under your nose: it’s the customers you already have.
Imagine your business is a garden. You could spend all your energy and money constantly planting new seeds. Or, you could carefully tend the garden you’ve already cultivated. The second approach is what yields a reliable, profitable harvest, season after season. That's what focusing on retention does for your business.
The Problem With a Leaky Bucket
Obsessing over acquisition while ignoring retention is like trying to fill a leaky bucket. You can pour water in all day, but if it’s constantly draining out the bottom, you’ll never get ahead. Retention is about plugging those leaks first.
When you make a conscious effort to keep your current customers happy, you start to see some incredible benefits:
- You Make More Money: It's simple. Loyal customers trust you, so they tend to spend more over time.
- You Spend Less on Marketing: It costs a whole lot less to keep a customer than to find a brand new one.
- You Get Honest Feedback: Long-term customers know your business and can give you the kind of direct, valuable feedback that helps you improve.
- You Gain True Brand Advocates: Happy customers don’t just stay—they talk. They become your best marketers, referring friends and family.
The financial case for this is staggering. Studies have consistently shown that a mere 5% increase in customer retention can boost profits by anywhere from 25% to 95%. That’s not a small jump. It shows a direct, powerful link between loyalty and your bottom line.
What’s Coming Up: The Metrics That Matter
So, how do you actually measure all this? You need the right tools for the job. We’re about to dive into the essential metrics, like Customer Retention Rate (CRR), which tells you what percentage of customers are sticking around. We’ll also look at its flip side, Customer Churn Rate, which shows you who’s leaving.
Another game-changing number is the Customer Lifetime Value (CLV). This metric predicts the total amount of revenue you can expect from a single customer throughout their entire relationship with your brand. Understanding and improving your CLV is key to making smarter decisions about everything from ad spend to customer service. If you want to get a head start, you can check out our guide on improving customer lifetime value.
Calculating Your Core Retention Metrics
Numbers tell a story, and when it comes to your business, customer retention metrics reveal the entire plot. It's time to move from theory to practice and get comfortable with a few key calculations. These aren't just abstract formulas; think of them as your business's health monitor, giving you a clear, unbiased look at customer loyalty.
Let's dive into the essential metrics you should be tracking. Each one offers a different angle on your customer relationships, helping you see who's sticking around, who's walking away, and what they're truly worth to your bottom line over time.
This image highlights how doubling down on retention directly impacts your business by lowering acquisition costs and boosting overall profitability.
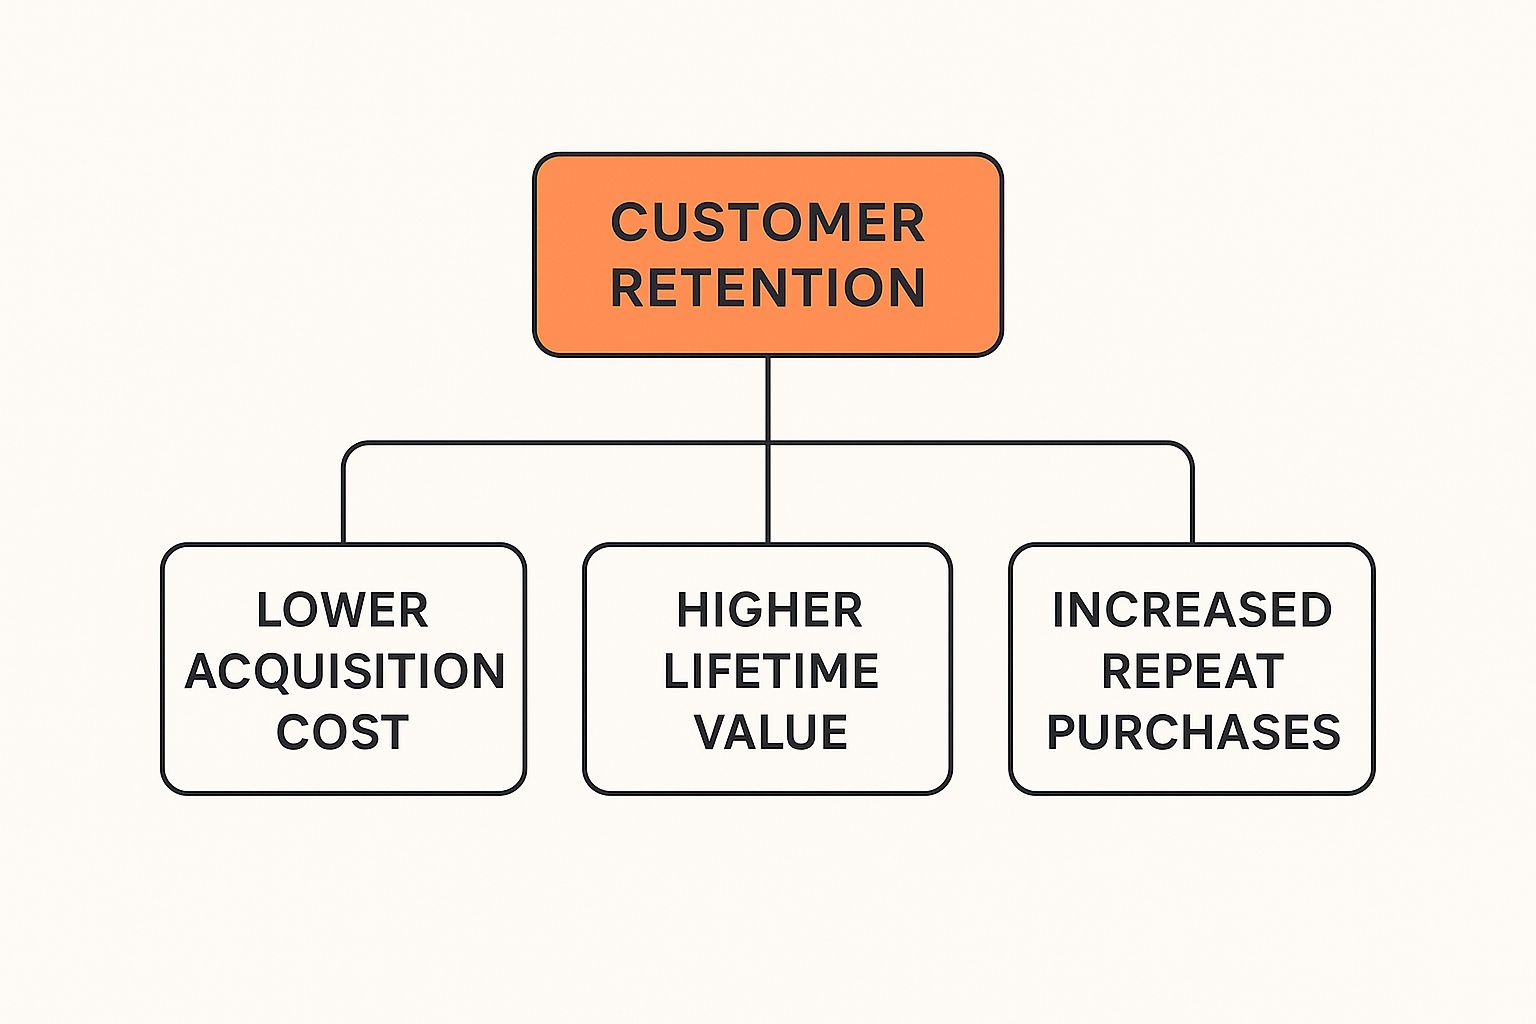
As you can see, a solid retention strategy isn't just a "nice-to-have"—it's the foundation of a more profitable and sustainable business.
Measuring Who Stays with Customer Retention Rate
Your Customer Retention Rate (CRR) is the bedrock of retention metrics. It simply tells you what percentage of customers stuck with you over a specific period. A high CRR is a fantastic sign that your customers are happy and loyal.
Calculating it is refreshingly simple. First, decide on a time frame—a month, a quarter, or a year.
- Find your number of customers at the start of the period (S).
- Count your total customers at the end of the period (E).
- Count how many new customers you gained during that period (N).
The formula is: CRR = [ (E - N) / S ] x 100
Let's say you started a quarter with 1,000 customers (S), ended with 1,200 (E), and brought in 300 new ones (N). Your CRR would be a solid 90%. This means you held onto 90% of your original customer base. For a more detailed walkthrough, our post on the customer retention rate calculation formula has more examples.
Understanding Who Leaves with Customer Churn Rate
While CRR tracks your wins, Customer Churn Rate focuses on the opposite: the percentage of customers who left. This is your early warning system, flagging potential problems with your products, pricing, or overall customer experience.
The formula is just as straightforward: Churn Rate = (Customers Lost / Customers at Start of Period) x 100
So, if you started with 1,000 customers and 100 of them left, your churn rate for that period is 10%. If you see this number suddenly jump, it’s a clear signal to dig in and find out why.
By tracking both CRR and churn, you get the full picture. They are two sides of the same coin—as one goes up, the other goes down. A healthy business is always pushing to increase retention and drive churn down.
Forecasting Future Revenue with Customer Lifetime Value
Finally, we have Customer Lifetime Value (CLV). This metric shifts your focus from a single sale to the entire long-term relationship, predicting the total profit you can expect from a single customer over their entire time with you.
A basic way to calculate it is: CLV = Average Purchase Value x Average Purchase Frequency x Average Customer Lifespan
For example, if a customer typically spends $50 per order, buys 4 times a year, and sticks around for 3 years, their CLV is $600. This number is pure gold for making strategic decisions, from figuring out your marketing budget to identifying your true VIP customers.
To make these concepts even clearer, here’s a quick-reference table summarizing the core metrics.
Key Customer Retention Metrics at a Glance
| Metric Name | Formula | What It Measures |
|---|---|---|
| Customer Retention Rate | [ (End Customers - New Customers) / Start Customers ] x 100 | The percentage of existing customers you kept over a period. |
| Customer Churn Rate | (Customers Lost / Customers at Start of Period) x 100 | The percentage of customers who left your business over a period. |
| Customer Lifetime Value | Average Purchase Value x Average Purchase Frequency x Avg. Customer Lifespan | The total revenue you can expect from a single customer account. |
Keeping this table handy will help you stay on top of the numbers that truly define your relationship with your customers.
Uncovering Deeper Insights with Advanced Metrics
While core metrics like CRR and CLV give you a fantastic high-level view, advanced metrics are your magnifying glass. They reveal the subtle behaviors that genuinely drive customer loyalty. It’s about moving beyond just knowing who stays to understanding how and why they stick around, which tells a much richer story.
This deeper level of analysis is what separates a good retention strategy from a great one. It helps you spot patterns, anticipate what customers will do next, and step in with the right message at the perfect moment. These insights are key to building a truly resilient business.
Measuring Return Business with Repeat Purchase Rate
One of the most telling e-commerce metrics is the Repeat Purchase Rate (RPR). It’s simple: this number shows you the percentage of your customers who have come back to buy from you more than once. A high RPR is a direct sign of product satisfaction and brand loyalty.
Think of it this way: the first sale might come from slick marketing, but the second sale? That comes from a great experience.
In the United States, 71% of sales leaders use customer retention rates as a key measure of customer satisfaction. This focus is crucial, as studies show 41% of lost accounts are due to poor follow-up, highlighting the need for strong engagement. You can discover more insights about customer retention and engagement at The Sales Collective.
Calculating RPR is straightforward:
RPR = (Number of Customers with More Than One Purchase / Total Number of Customers) x 100
A rising RPR means your customers are voting with their wallets, again and again.
Combining Metrics for a Fuller Picture
No single customer retention metric can tell you everything. The real magic happens when you start combining them to see the bigger picture. Try tracking these two alongside your RPR:
-
Purchase Frequency (PF): This metric calculates how often, on average, a customer buys from you within a certain period. It answers the question, "How many times does our typical customer shop with us in a year?"
-
Average Order Value (AOV): This shows you how much your average customer spends in a single transaction. It’s a direct measure of how much value they see in your products at any given moment.
When you look at these metrics together, the story comes to life. For example, a high RPR is great on its own. But a high RPR combined with a rising AOV? That’s even better. It means your loyal customers are not only returning but are also spending more each time they do.
This combination of data points allows you to segment your audience with incredible precision. You can identify your true VIPs—those with a high RPR, PF, and AOV—and create special campaigns just for them. It also helps you spot at-risk customers who might just need a gentle nudge to come back. This kind of detailed segmentation is a core concept you can explore further in our guide on what is cohort analysis.
How Retention Metrics Translate into Real-World Profitability
A customer retention metric isn't just another number to stick on a dashboard. Think of it as a direct line to your company's financial health. These figures are the bridge between how customers behave and your bottom line, showing exactly how loyalty turns into actual, spendable profit. The logic behind it is simple but incredibly powerful: keeping a customer you already have is always cheaper than fighting to get a new one.
Once you start looking at your retention data like a strategic compass, its true value snaps into focus. A high Customer Lifetime Value (CLV), for instance, doesn't just tell you that you have happy customers. It signals a predictable stream of future revenue you can plan around, which makes everything from financial forecasting to budgeting far more accurate.
Turning Expenses into Growth Engines
Strong retention numbers can fundamentally change the way you run your business. They guide smarter decisions everywhere, transforming what might look like costs into powerful investments that fuel long-term growth.
- Smarter Product Development: Your most loyal customers are often your most vocal and engaged users. Their feedback is gold, pointing you directly toward the product improvements and new features that have the highest chance of being a hit.
- Sharpened Marketing Efforts: Forget guessing what works. You can analyze the journey of your most profitable customers and double down on the channels and messages that brought them in. It's about finding more of your best people.
- Proactive Customer Support: When you spot patterns that lead to churn, your support team can get ahead of problems. Instead of just reacting to complaints, they can proactively reach out to at-risk customers, saving relationships before they sour.
At the end of the day, a serious focus on retention builds a more resilient business. A company built on repeat business is far less vulnerable to shifting market trends and skyrocketing ad costs than one stuck on the treadmill of constantly chasing new leads.
A Tale of Two E-commerce Stores
To really see this play out, let's picture two online shops: "AcquireCo" and "Retainify."
AcquireCo is completely obsessed with top-line growth. They pour every spare dollar into aggressive ad campaigns to bring in new buyers. Their traffic numbers look amazing, but their Repeat Purchase Rate is dismal. They're on a constant, expensive hamster wheel where their profitability is chained to their ad spend.
Retainify, on the other hand, puts its energy into understanding its customer retention metric. They use that data to build a killer loyalty program, send out personalized thank-you notes, and foster a genuine community around their brand. Their initial growth might look a little slower, but their CLV is three times higher than AcquireCo’s.
Over time, Retainify's happy customers become their best marketers, driving word-of-mouth referrals that cost them nothing. While AcquireCo is sweating over volatile customer acquisition costs, Retainify is building a stable, profitable business on a foundation of genuine loyalty. Their data-driven strategy doesn't just win them sales; it builds them a sustainable company that's set up to win for years to come.
Putting Your Retention Metrics into Action
Knowing your numbers is one thing, but the real magic happens when you use those customer retention metrics to make meaningful changes. Think of these data points less like numbers for a report and more like a diagnostic tool. They tell you exactly what’s working with your customer experience and, more importantly, where you’re dropping the ball.
By turning these insights into concrete actions, you create a powerful cycle: measure, improve, and watch your business grow.
Let's walk through a common scenario for an e-commerce brand. While looking over their quarterly data, the team spots a worrying trend: their Repeat Purchase Rate (RPR) has dipped by 15%. They’re getting new customers, but those people aren't coming back for a second purchase. It’s the classic "leaky bucket" problem, and their RPR is the alarm bell telling them it’s time to fix the leak.
This is where the real work starts. The team can now use this specific metric to guide their investigation and ask the right questions to uncover the root cause.
Diagnosing the Problem with Data
Instead of just guessing what's wrong, the brand dives into its analytics. They start by segmenting customers who only ever made one purchase, looking for common threads.
This investigation quickly uncovers a major friction point: their post-purchase experience is clunky and impersonal. After placing an order, customers get a generic confirmation email and then... crickets. No shipping updates, no follow-up, and certainly no incentive to come back.
The data paints a clear picture. The drop in RPR isn't because of a bad product; it's an engagement problem. The brand is failing to build any kind of relationship after that first sale, making customers feel like they were just another transaction.
It's important to remember that retention benchmarks can differ wildly. Average customer retention rates for media and professional services hover around 84%, while industries like hospitality and travel see rates closer to 55%. Understanding your industry's average provides context for your own metrics. Discover more insights about customer retention rates across industries at Exploding Topics.
Implementing a Solution
With a clear diagnosis in hand, the brand can build a targeted strategy to overhaul its post-purchase journey and get that Repeat Purchase Rate moving in the right direction. Their action plan involves a few key steps:
- Personalized Follow-Up Sequences: They set up automated emails with real-time shipping updates, helpful tips on using the new product, and a request for feedback a week after delivery.
- A Simple Loyalty Program: They introduce a points-based system. Customers earn rewards on their very first purchase that they can use on their next one, giving them an immediate reason to return.
- Exclusive Offers for First-Time Buyers: A few weeks after the initial purchase, they send a special discount code designed specifically to encourage that all-important second order.
This is where platforms like Toki make a huge difference. Using integrated analytics, a business can quickly spot a dip in a key customer retention metric.

From there, they can immediately deploy gamification features—like points, badges, and challenges—to address the problem head-on. This turns a data-driven insight into an engaging, retention-boosting action, all without having to leave the platform. It’s this direct link between measurement and action that closes the loop and drives real results.
Common Questions About Retention Metrics
Diving into retention metrics always brings up a few practical questions. Once you start tracking the numbers, you'll inevitably run into these. Let's clear them up so you can move from theory to action.
What Is a Good Customer Retention Rate?
This is the big one, and the honest answer is: it depends. There’s no magic number that works for every business, because a "good" rate is all about context and industry.
A SaaS company with a subscription model might see anything less than 95% as a problem, since their business is built on long-term commitments. On the other hand, an e-commerce store could be doing great with a 35% retention rate.
The real goal isn't to hit some universal benchmark. It's to figure out your own baseline and then work on improving it, quarter after quarter.
Your biggest competitor should be your past performance. Focus on beating your own numbers, and you're already winning.
How Often Should I Track These Metrics?
The right cadence for tracking really comes down to your sales cycle. You want to match your reporting schedule to the natural rhythm of how customers buy from you.
- For high-transaction businesses: If you're running an e-commerce shop or a mobile app, you should probably be looking at metrics like Customer Retention Rate (CRR) and Repeat Purchase Rate (RPR) every month. This frequency helps you spot trends early and react fast.
- For subscription or B2B businesses: Companies with longer contracts or sales cycles will get more value from looking at churn on a quarterly and annual basis. This lines up with renewal periods and gives you a more stable, big-picture view of loyalty.
Picking the right timeframe makes sure the data you’re analyzing is actually useful.
Can I Track Retention Without Expensive Tools?
Absolutely. You don't need a huge software budget to get started. In fact, you can begin tracking the most important retention metrics with tools you’re already using.
A simple spreadsheet is a great place to begin calculating your basic CRR and Churn Rate. Getting your hands dirty with the data like this is actually a fantastic way to understand what the numbers truly mean.
As you scale, though, doing this manually gets old fast. It becomes a time-sink and leaves room for error. That’s when dedicated platforms really start to pay for themselves. They handle the number-crunching automatically, dig up deeper insights, and help you spot opportunities you'd otherwise miss.
Ready to stop guessing and start growing? Toki provides the automated analytics and powerful gamification tools you need to turn retention insights into real revenue. Discover how Toki can help you build a loyal customer base today.