A Guide to Essential Metrics for Ecommerce
Discover the essential metrics for ecommerce success. Our guide breaks down how to track, analyze, and optimize KPIs to drive real business growth.
Trying to grow an e-commerce business without tracking the right numbers is a bit like flying blind. You might be moving forward, but you have no idea how fast you're going, how much fuel is left, or if you're about to fly into a mountain. This guide is all about cutting through the noise and focusing on the metrics that actually drive growth, starting with four foundational pillars: traffic, conversion, customer value, and profitability.
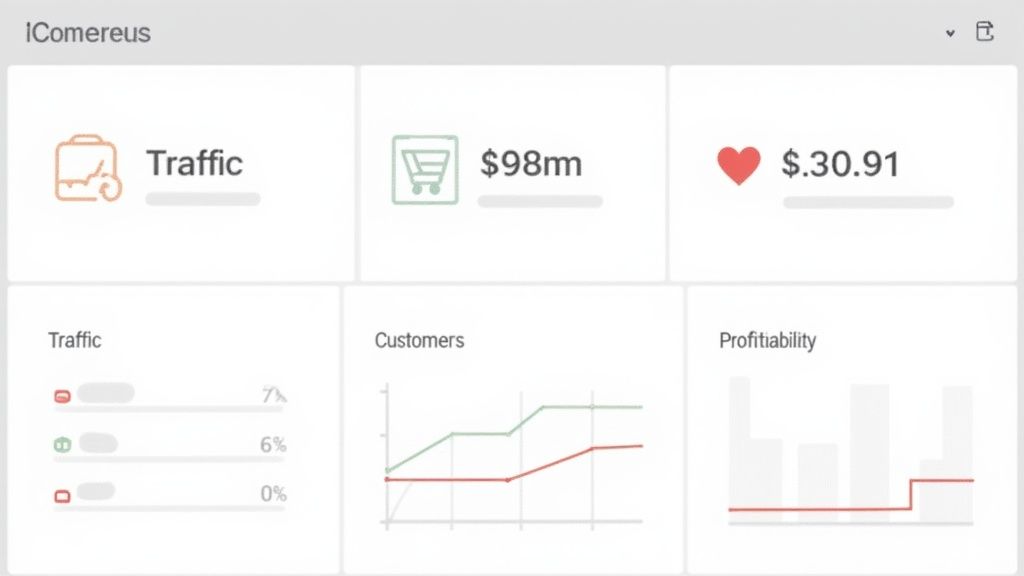
Why Every Ecommerce Brand Needs a Data Dashboard
Getting a handle on your key metrics is the absolute first step to making smarter decisions. It’s how you optimize your ad spend, fine-tune your website, and ultimately build a business that lasts. Don't just think of it as staring at spreadsheets; think of it as learning the language your business speaks. These numbers tell you exactly what your customers love, what they hate, and where your biggest growth opportunities are hiding. A solid metrics dashboard is the bedrock of effective ecommerce growth strategies.
Here, we'll break down the most vital e-commerce metrics into simple, manageable categories. The goal is to get you from just collecting data to actually using it to make a real impact.
The Four Pillars of Ecommerce Measurement
Let’s get grounded. Pretty much every metric that matters in e-commerce can be sorted into one of four core categories. Each one answers a big, important question about your business's health. If you can get your head around these four, you'll have a solid framework for everything that follows.
To put it simply, these are the big questions you need to answer.
Core Ecommerce Metric Categories at a Glance
| Metric Category | What It Measures | Key Question It Answers |
|---|---|---|
| Traffic & Acquisition | How potential customers find and arrive at your online store. | "How are people discovering my brand?" |
| Conversion & Sales | The effectiveness of your site in turning visitors into buyers. | "Are my visitors turning into customers?" |
| Customer Value & Profitability | The financial health and long-term worth of your customer base. | "How much is each customer worth, and are we profitable?" |
| Retention & Loyalty | Your ability to bring existing customers back for more purchases. | "Are my customers returning to make repeat purchases?" |
Understanding this framework helps you see the bigger picture and how different parts of your business influence one another.
The real magic happens when you see these metrics as an interconnected system. A flood of traffic is great, but it’s just noise if none of those visitors convert. High sales volume feels good, but it won’t keep you in business if your acquisition costs are through the roof or nobody ever comes back for a second purchase.
Of course, tracking and visualizing these numbers is a whole other challenge. You'll need the right tools in your tech stack to pull this off. To explore your options, check out our guide on the best ecommerce analytics tools. Once you get comfortable with these four pillars, you'll create a powerful feedback loop that fuels constant improvement and pushes your brand forward.
1. Website Traffic: The Digital Footprint of Your Customers
Before anyone can buy from you, they have to find you. Simple, right? Think of your website traffic as the digital equivalent of foot traffic in a brick-and-mortar store. It’s the lifeblood of your business, the first and most critical step in anyone's journey to becoming a customer.
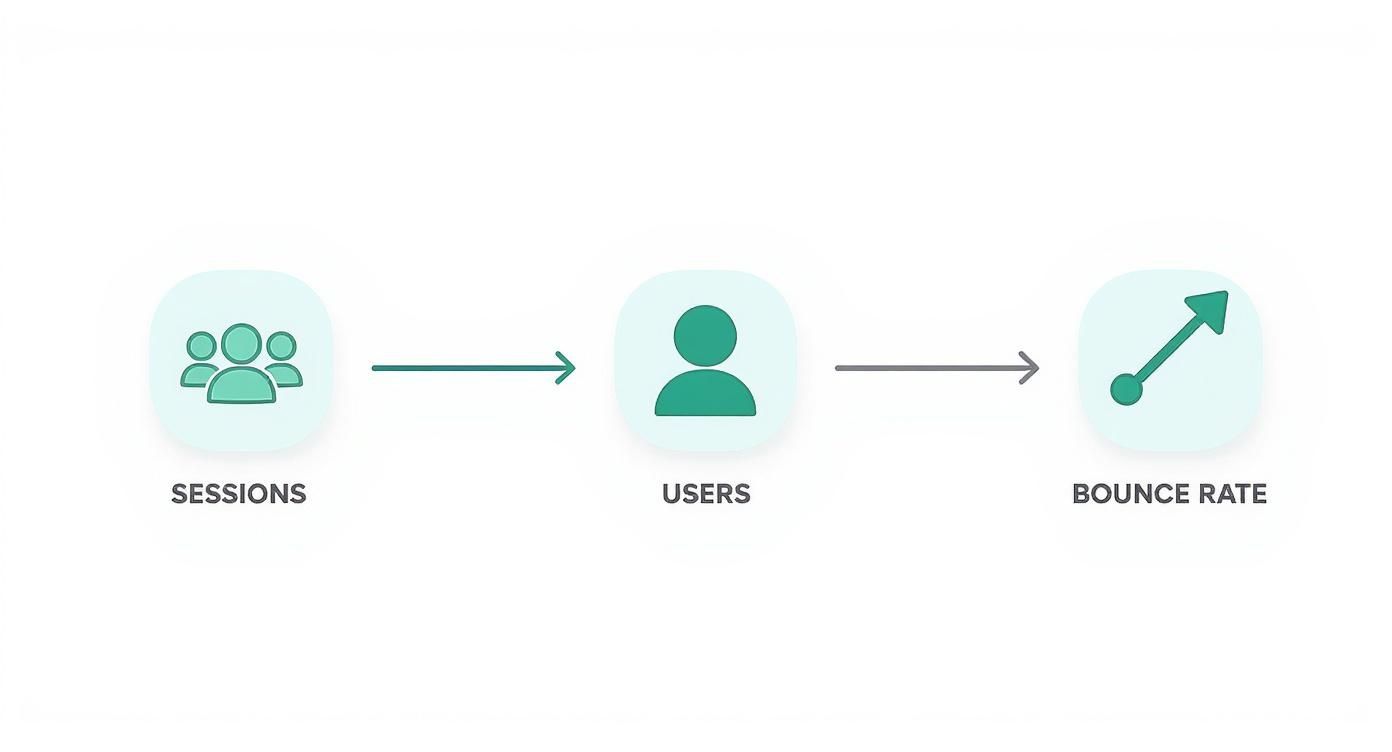
But just counting visitors isn’t enough. You need to understand the story behind the numbers. We’ll look at core metrics like Sessions, Users, and Bounce Rate to see what they reveal about the health of your customer acquisition strategy.
A User is a unique person who visits your site. A Session is what they do during a single visit—browsing pages, adding items to their cart, etc. One User can have many Sessions. It’s like a loyal shopper who visits your store on Tuesday and comes back again on Saturday. Same person, two different shopping trips.
What Your Traffic Data is Really Telling You
Looking at these numbers in a vacuum won't get you very far. The real magic happens when you see how they interact. A flood of new users sounds fantastic, but if they all leave immediately, you have a problem.
Bounce Rate is the percentage of visitors who land on your site and leave without doing anything else—no clicks, no scrolling, no interaction. They're the window shoppers who poke their head in the door, take one look, and walk right back out.
Let's say you launch a big ad campaign that drives 10,000 new Users to your product page. Great! But then you see your Bounce Rate has shot up to 85%. That's a huge red flag. It tells you there's a disconnect. The ad got their attention, but the page they landed on didn't deliver on the ad's promise. Maybe you targeted the wrong people, or the on-site experience just isn't compelling enough.
To really get to the bottom of this, you need to know where these people are coming from.
Pinpointing Your Most Valuable Traffic Sources
Not all traffic is created equal. Some sources bring in curious browsers, while others deliver motivated buyers. By understanding where your visitors originate, you can invest your time and money where it counts. The main sources are:
- Organic Traffic: People who find you through a search engine like Google. This is a powerful signal of strong brand presence and good SEO.
- Paid Traffic: Anyone who clicks on one of your ads, whether it's on Google, Instagram, or another platform. This is traffic you buy, and it's highly measurable.
- Social Traffic: Visitors arriving from social media platforms like TikTok, Facebook, or Pinterest. This shows you how well your social media game is performing.
- Direct Traffic: Users who type your URL straight into their browser. These are often your most loyal customers—the ones who know you by name.
Breaking down your metrics by source helps you answer the important questions. Do visitors from Organic search stick around longer than those from Paid ads? Do people coming from Instagram add more items to their cart? This kind of analysis is where raw data becomes a roadmap for growth. It's the first step in decoding the customer journey, and you can learn more about what is behavioral analytics in our in-depth guide.
Measuring the Journey From Click to Purchase
Getting someone to your website is only half the battle. Now, the real work begins: turning that initial curiosity into a sale. This is where we measure how good your store is at converting "window shoppers" into actual paying customers. The single most important metric for this is your Conversion Rate (CR)—it's the ultimate report card for your website's performance.
Think of it this way: your conversion rate tells you what percentage of visitors took the action you wanted them to take (i.e., they bought something). The formula is refreshingly simple:
(Number of Sales / Number of Sessions) x 100 = Conversion Rate (%)
So, if your store had 50 sales from 2,000 sessions in a month, you'd calculate (50 / 2,000) * 100 to get a conversion rate of 2.5%. This little number packs a big punch, telling you a story about how well your product pages, checkout flow, and overall site experience are working together.
What Is a Good Conversion Rate?
It’s the question every e-commerce manager asks. Across the board, the global average conversion rate floats somewhere between 2.5% and 3%. That means for every 100 people who visit, only two or three will end up making a purchase.
But "average" can be misleading. That number swings wildly depending on what you sell. The food and beverage industry, for instance, often enjoys rates around 6.11%, while high-end luxury goods might see conversions closer to 1.19%. You can get a great breakdown of these industry-specific conversion rates on RedStagFulfillment.com.
This chart really drives the point home, showing just how different the benchmarks are from one sector to the next.
The takeaway? "Good" is completely relative. What's a fantastic rate for a jewelry brand could be a sign of trouble for a grocery delivery service. Context is everything.
Beyond the Final Sale: Micro-Conversions
A sale is the ultimate goal, but a lot of smaller steps, or micro-conversions, happen along the way. Tracking these gives you a much clearer picture of what your shoppers are doing and, more importantly, where they're dropping off. Think of them as clues that help you solve the mystery of your sales funnel.
Two of the most telling micro-conversions are the Add-to-Cart Rate and Shopping Cart Abandonment. They represent the critical moment a shopper goes from just browsing to showing real intent to buy.
Plugging the Leaks in Your Sales Funnel
Imagine your sales funnel is a bucket. You pour traffic in the top, but there are holes along the sides where potential customers leak out. Shopping cart abandonment is, by far, the biggest hole.
Shopping Cart Abandonment Rate is the percentage of shoppers who add items to their cart but bail before paying. The industry average for this is a jaw-dropping 70%. That's a huge amount of potential revenue just walking out the door.
So, why do people leave? It almost always comes down to friction—something in the process that makes it difficult or frustrating to finish the purchase. The main culprits are usually pretty easy to spot:
- Surprise Costs: Nothing kills a sale faster than unexpected shipping fees, taxes, or handling charges popping up at the very last second. Be upfront about all costs.
- A Painful Checkout: Forcing someone to create an account or slog through a five-page form is a guaranteed way to lose them. A simple, clean guest checkout option is a must.
- Trust Issues: If your site looks unprofessional or lacks clear security badges (like SSL certificates), return policies, or customer reviews, shoppers will hesitate to hand over their credit card details.
- Bad Mobile Experience: More and more people shop on their phones. If your checkout process is a nightmare to navigate on a small screen, you're alienating a huge chunk of your audience.
By finding and fixing these leaks, you can make a serious impact on your overall conversion rate. Paying attention to these micro-conversions gives you the actionable insights needed to smooth out the path from click to purchase and turn more of that hard-won traffic into real revenue.
Optimizing Your Profitability and Customer Value
Getting sales is great, but building a profitable e-commerce business is a whole different ballgame. This is where you graduate from simply chasing transactions to engineering smart, sustainable growth. The financial health of your store really comes down to a delicate dance between three key numbers: Average Order Value (AOV), Customer Acquisition Cost (CAC), and Customer Lifetime Value (CLV).

Get these right, and you shift from short-term wins to long-term stability. It’s all about building a business where every customer becomes more valuable over time.
Boosting Your Average Order Value
Think of Average Order Value (AOV) as the most powerful lever you can pull for an instant revenue boost—without spending a dime more on traffic. It simply tells you the average dollar amount every single customer spends when they place an order on your site.
The formula couldn't be simpler:
Total Revenue / Number of Orders = Average Order Value
A higher AOV means more cash in the bank from the same number of customers, which is a direct shot in the arm for your profitability. The name of the game is persuading shoppers to add just one more thing to their cart. A few tried-and-true tactics work wonders here.
- Product Bundling: Group complementary items together and offer a slight discount. Think of a "creator's kit" that includes a camera, lens, and memory card—it just makes sense for the customer.
- Upselling and Cross-selling: On the product or checkout page, offer a better, premium version of an item (the upsell) or suggest related accessories that complete the purchase (the cross-sell).
- Free Shipping Thresholds: This one is classic for a reason. Offer free shipping for orders over a specific value, like $75, and watch how many people add a little something extra to their cart to hit that magic number.
By focusing on AOV, you’re squeezing more value out of every single conversion you already worked so hard to get.
The Cost of a New Customer
Next up is Customer Acquisition Cost (CAC). This metric is a dose of reality, telling you exactly how much you spend, on average, to win over a single new customer. It puts a hard number on your marketing efforts.
To figure it out, just divide all your sales and marketing costs by the number of new customers you brought in during that same period.
Total Sales & Marketing Costs / Number of New Customers Acquired = CAC
And we mean all your costs—ad spend, content creation, influencer fees, even the salaries of your marketing team. Knowing your CAC is non-negotiable because it determines if you're actually making money on new customers from day one. If your CAC is $50, but their first purchase is only worth $40, you're technically losing money on that first sale.
That’s why you can’t look at CAC in a vacuum. Its real importance is only clear when you stack it up against how much that customer is worth in the long run.
The Ultimate Report Card: Customer Lifetime Value
This brings us to Customer Lifetime Value (CLV or LTV), which is arguably the holy grail of metrics for ecommerce. CLV is the total amount of revenue you can reasonably expect to generate from a single customer over their entire relationship with your brand.
Think of it like planting a tree. Your Customer Acquisition Cost is the price of the seed and the work to plant it. The Customer Lifetime Value is all the fruit you get to harvest from that tree for years and years.
Suddenly, the goal isn't just to get customers cheaply; it's to get customers who will stick around, buy again, and spend more over their lifetime. A healthy business model needs a CLV that is much higher than its CAC. The gold standard ratio is often cited as 3:1—meaning a customer is worth three times what you paid to acquire them.
This mindset changes everything. You stop chasing one-off sales and start building genuine relationships. This is where tools like loyalty programs, such as Toki, become so powerful. By rewarding customers for their repeat business and making them feel like part of a community, you are actively increasing your CLV. That initial acquisition cost transforms from an expense into a highly profitable, long-term investment.
As you dial in these financial metrics, you’re also positioning yourself to capture a piece of a massive pie. Global e-commerce sales are on track to hit $6.42 trillion, with mobile commerce expected to make up 59% of that. You can dig into more of these numbers and other global e‑commerce statistics on SmartInsights.com.
Building Loyalty and Reducing Customer Churn
It’s an old saying in business, but it holds true: acquiring a new customer can cost five times more than keeping an existing one. Because of this, the sharpest e-commerce brands aren't just hunting for new sales; they're focused on building real, long-term loyalty. This section of your dashboard is all about measuring how well you’re turning one-time buyers into a loyal following.
We’re going to look at the numbers that tell the story of customer happiness and brand stickiness. We'll dive into Customer Retention Rate, Repeat Purchase Rate, and its evil twin, Churn Rate. Getting a grip on these helps you shift from a purely transactional business to a relational one—and that’s where sustainable growth really comes from.
Measuring How Many Customers You Keep
The most straightforward measure of loyalty is your Customer Retention Rate (CRR). In simple terms, it tells you what percentage of your customers from one period stuck around to buy from you again in the next.
Imagine your customer base is a bucket of water. New customers are the water you’re constantly pouring in, but churn is a hole in the bottom. Your retention rate is a measure of how effectively you’re plugging that hole. A high CRR is a fantastic signal that you've found product-market fit and are delivering an experience that keeps people happy.
Here's the standard formula to figure it out for a specific period, like a quarter:
[ ( Customers at End of Period - New Customers Acquired ) / Customers at Start of Period ] x 100
So, let's say you started the quarter with 1,000 customers. You brought in 200 new ones, and by the end of the quarter, you had 1,100 total customers. Your CRR would be 90%. That means you managed to keep nine out of ten of your existing customers from walking away.
A rising retention rate is one of the healthiest signs for an e-commerce store. Even a 5% increase in customer retention can boost profits by 25% to 95%, because repeat buyers tend to spend more over time and cost nothing to re-acquire.
Understanding Repeat Purchase Behavior
While retention tells you if customers are staying, the Repeat Purchase Rate (RPR) reveals how often they're actually coming back to buy. This metric is a brilliant indicator of how much people truly value what you sell.
It’s calculated by looking at the percentage of your customer base that has made more than one purchase.
Number of Customers with >1 Purchase / Total Number of Customers = Repeat Purchase Rate
A strong RPR suggests that customers don't just like your product; they’re actively making it a part of their lives. This is mission-critical for brands selling things that get used up, like coffee or skincare, where the entire business model hinges on repeat orders. This is also where loyalty programs, like those from Toki, can be a game-changer by giving customers a compelling reason to place that second, third, and fourth order.
The Opposite of Loyalty: Customer Churn
On the other side of the coin from retention is the Churn Rate. This is the metric that measures the percentage of customers who stop buying from you over a set period. Nobody likes to look at it, but ignoring it is a huge mistake.
Lost Customers during Period / Total Customers at Start of Period = Churn Rate
Think of a high churn rate as a blinking red warning light on your dashboard. It could be pointing to problems with your product quality, slow shipping, poor customer service, or maybe a competitor who is suddenly offering a much better deal. Keeping a close eye on churn forces you to ask tough questions and solve the root causes before they spiral.
Although our focus here is e-commerce, the core principles of keeping customers are pretty universal. If you want to dig deeper into proven ways to stop customers from leaving, this guide on SaaS Retention Strategies to Stop Churn has some great insights that can often be adapted for e-commerce.
By getting a handle on these three metrics, you'll gain a much clearer picture of your customer relationships. You’ll start to see retention not as something that just happens, but as a core strategy for building a more resilient and profitable business.
9. Gauging the True Impact of Your Marketing Spend
https://www.youtube.com/embed/qy2jc5q_184
Are your marketing dollars actually working for you? Pouring money into ads without tracking the return is basically just gambling. It's a game of chance, not a business strategy. To get a real answer, you need to get comfortable with one of the most fundamental metrics in e-commerce: Return On Ad Spend (ROAS).
ROAS tells you, in plain terms, how much revenue you're generating for every single dollar you spend on advertising. It cuts right through the noise of vanity metrics like clicks and impressions to show you what really moves the needle: profit.
The formula couldn't be simpler, but it's incredibly powerful:
Total Revenue from Ad Campaign / Total Cost of Ad Campaign = ROAS
Let's say you spent $2,000 on a Google Ads campaign, and it brought in $8,000 in sales. Your ROAS is 4:1. For every dollar you put in, you got four dollars back. Simple as that. A 4:1 ratio is often seen as a healthy benchmark, but what’s “good” for you really comes down to your own profit margins.
Looking Beyond ROAS for the Full Picture
Here’s a crucial catch: a strong ROAS doesn't automatically mean your marketing is profitable. Why? Because ROAS measures revenue, not profit. That's why it's so important to look at it alongside your Customer Acquisition Cost (CAC). Think of it this way: ROAS tells you if a specific ad campaign is effective, while CAC tells you if your overall strategy for getting new customers is sustainable.
Imagine your ROAS is 3:1. Sounds okay, right? But what if your product margins are only 25%? In that scenario, you're actually losing money on every single sale from that ad. You brought in $3 for every $1 spent, but making and delivering the product cost you more than that. This is where you have to connect the dots. To get a more complete picture, it's vital to understand the nuances of cross-channel marketing attribution and see how all your marketing efforts work together to land a sale.
Why Great Ads Can Still Fail
Even a brilliant, high-performing ad campaign can fall flat if your on-site experience is broken. You could be paying to send thousands of eager buyers to your store, only to have them walk away right before they click "buy." This brings another critical metric into the spotlight: cart abandonment.
The global average shopping cart abandonment rate is a staggering 71.3%. It gets even worse on mobile, climbing to 77.2%. Think about that—for every 100 shoppers who add something to their cart, only about 29 of them actually finish the purchase.
What causes this massive drop-off? More often than not, it's a surprise shipping cost or a clunky, confusing checkout process. Measuring the real impact of your marketing means looking beyond the ad itself. You have to analyze the entire customer journey to make sure your budget isn't just buying clicks, but actually building a profitable business for the long haul.
Common Questions About Ecommerce Metrics
When you're swimming in data, it's easy to get lost. You start wondering where to look first, what actually matters, and how often you should even be checking these numbers. Let's clear up some of the most common questions and help you build a solid, practical approach to measurement.
What Are the Top 3 Metrics for a New Ecommerce Store?
When you’re just starting out, you can ignore almost everything else and laser-focus on three core numbers. These will tell you if your brand has a pulse and a path forward.
- Website Traffic (Users & Sessions): Are people showing up? Before anything else, you just need to know if your marketing is getting anyone to your digital front door.
- Conversion Rate: This is the ultimate reality check. It tells you if people actually want what you're selling and if your site makes it easy for them to buy. A good product and a clunky website don't convert.
- Customer Acquisition Cost (CAC): Can you afford to grow? This metric tells you exactly what you're paying to get each new customer, which is critical for knowing if your business model is actually sustainable from the get-go.
How Often Should I Check My Ecommerce Metrics?
Not every metric deserves your daily attention. Trying to watch everything all the time is a recipe for burnout. A much smarter approach is to think about them in terms of speed.
- Daily or Weekly Checks: Your "fast-moving" metrics like Website Traffic, Conversion Rate, and daily sales need frequent check-ins. This helps you spot a broken link, a sudden traffic spike from a social post, or a technical glitch right away.
- Monthly or Quarterly Checks: "Slow-moving" metrics like Customer Lifetime Value (CLV), Churn Rate, and Repeat Purchase Rate are best viewed from a distance. Looking at them over a longer timeframe smooths out the random noise and reveals the real, meaningful trends in customer behavior.
The goal isn't to be glued to your dashboard. It's about getting into a consistent rhythm. That consistency is what helps you tell the difference between a one-day fluke and a real pattern that needs your attention.
My Conversion Rate Is Low—What Should I Investigate First?
A low conversion rate is a classic sign of friction somewhere in your customer's journey. Before you start redesigning your entire site, put on your detective hat and check the usual suspects first. These five areas are almost always where the problem lies:
- Website Speed: How fast does your site load? Even a one-second delay can send people running.
- Mobile Experience: Don't just check if it works on a phone. Is it genuinely easy and enjoyable to shop on a smaller screen?
- Shipping Costs: Are you surprising people with high shipping fees at the very end? This is the #1 killer of conversions. Be upfront.
- Product Pages: Do your photos sell the product? Are your descriptions compelling? Are customer reviews easy to find?
- Checkout Process: Count the clicks. A long, complicated checkout with too many fields is a guaranteed way to lose a sale.
Ready to turn your happy customers into your most powerful growth engine? Toki provides all the tools you need—from points and referrals to paid memberships—to build a thriving brand community and drive repeat sales. Start building lasting loyalty today at https://buildwithtoki.com.