How to Measure Customer Loyalty: Proven Strategies
Learn how to measure customer loyalty effectively with proven methods. Boost retention and growth by understanding what drives your customers' loyalty.
To really understand customer loyalty, you have to look at it from all angles. It’s about what your customers say, what they do, what they spend, and how they interact with your brand beyond just making a purchase. Blending feedback like Net Promoter Score (NPS) with hard data like Repeat Purchase Rate (RPR) is how you get the full story—one that actually helps you predict growth and keep your customers happy.
Why Measuring Loyalty Is Your New Growth Engine
Let's be honest, winning new customers is getting more expensive by the day. That's why smart businesses are shifting their focus from constantly chasing new leads to nurturing the relationships they already have. This isn't just a fleeting trend; it’s a core strategy for building a resilient business.
The old loyalty playbook—think simple punch cards and one-size-fits-all points systems—just doesn't cut it anymore. Real loyalty today is built on a foundation of personalized experiences, genuine emotional connection, and real value that makes customers feel like you actually get them.
To build that kind of powerful connection, you first have to know where you stand. And that means you need a clear, data-driven way to measure loyalty instead of just guessing.
The Four Pillars of Customer Loyalty Measurement
From my experience, the most effective way to get a complete picture is to break loyalty down into four distinct pillars. Each one gives you a different piece of the puzzle.
Here's a quick breakdown of what I call the four pillars of loyalty measurement. Seeing them side-by-side really clarifies how they work together to give you a complete view of your customer relationships.
| Pillar | What It Measures | Example Metrics |
|---|---|---|
| Attitudinal Loyalty | Customer sentiment and feedback. (What they say) | Net Promoter Score (NPS), Customer Satisfaction (CSAT) |
| Behavioral Loyalty | Concrete, repeatable actions. (What they do) | Repeat Purchase Rate (RPR), Purchase Frequency (PF) |
| Transactional Loyalty | The financial value of a customer. (What they spend) | Customer Lifetime Value (CLV), Average Order Value (AOV) |
| Engagement Loyalty | Non-purchase interactions with your brand. (How they interact) | Social media engagement, review submissions, app usage |
Looking at just one of these pillars in isolation can be incredibly misleading. It’s the combination that unlocks true insight.
The real power comes from connecting these dots. A customer might say they love your brand (attitudinal) but rarely make a purchase (behavioral). That’s a red flag telling you there's a disconnect somewhere that you need to fix.
The Decisive Shift Toward Retention
This move toward prioritizing loyalty isn't just a gut feeling; it’s a direct response to some pretty stark market realities. A recent survey of over 800 CX professionals revealed that 86% of leaders agree customer loyalty is an increasingly critical business metric.
Why the sudden urgency? Because customer acquisition costs have shot up by nearly 60% in the last five years alone. This makes retaining customers not just a "nice-to-have," but a financial imperative. If you're looking to dive deeper, there are some excellent website strategies for customer engagement and retention that can help you capitalize on this shift.
A Framework for a 360-Degree View
Relying on a single metric is like trying to drive while only looking in the rearview mirror. You might see where you've been, but you have no idea what's ahead. For example, a high customer satisfaction score can feel great, but it might be hiding a low repeat purchase rate. This could mean customers are happy with their one-time transaction but see no compelling reason to come back.
By building your measurement strategy around these four pillars, you create a complete dashboard for customer health. This guide will walk you through the most important metrics in each pillar, show you how to track them, and—most importantly—how to turn that data into actions that build an unbreakable bond with your customers.
Understanding What Your Customers Truly Think
If you really want to get a handle on customer loyalty, you have to look past the numbers on a sales report and get inside your customers' heads. What do they actually think about your brand? This is where attitudinal metrics come into play, giving you a direct line to how your customers are feeling.
Think of these metrics as your early warning system. They help you spot friction points and understand how your brand is perceived before those issues start quietly chipping away at your customer base. Flying blind on customer sentiment is a risky game—even your most frequent buyers can walk away if their experience sours.
Gauging Overall Brand Health with Net Promoter Score
There’s a reason the Net Promoter Score (NPS) is so popular: it’s simple, powerful, and gives you a fantastic high-level view of brand advocacy. It all comes down to a single question: "On a scale of 0-10, how likely are you to recommend our brand to a friend or colleague?"
Based on how people respond, you can sort them into three groups:
- Promoters (Score 9-10): These are your die-hard fans. They're not just buying from you; they’re actively telling others to do the same.
- Passives (Score 7-8): These folks are satisfied, but that's about it. They're not unhappy, but they aren't loyal champions either, making them prime targets for your competitors.
- Detractors (Score 0-6): These are unhappy customers. They're at a high risk of churning and might even share their negative experiences, damaging your reputation.
Calculating your NPS is straightforward: just subtract the percentage of Detractors from the percentage of Promoters. The score you get, from -100 to +100, becomes your loyalty benchmark.
But the real magic of NPS isn't just the number. It's the "why." Always ask a follow-up, open-ended question like, "What's the main reason for your score?" The answers are pure gold. A Detractor might point out a clunky checkout, while a Promoter raves about your lightning-fast shipping. This is where tools like Toki’s analytics become indispensable, helping you track these scores over time to see if your improvements are actually moving the needle.
Measuring Satisfaction at Specific Touchpoints
NPS gives you the big picture, but sometimes you need to zoom in on a specific interaction. For that, the Customer Satisfaction Score (CSAT) is perfect. It measures short-term happiness right after a specific event, like a support call or a recent purchase.
You typically measure it with a direct question, such as, "How satisfied were you with your recent support experience?" on a simple 1-5 scale.
Here's how that might look in the real world:
- A retail store could automatically email a CSAT survey after a customer service chat. A string of low scores is a clear signal that your agents might need more training.
- A Shopify merchant could use a pop-up on the order confirmation page to ask about the checkout experience itself.
CSAT delivers immediate, actionable feedback. If you see scores related to delivery suddenly dip, you know exactly where to start digging.
Evaluating the Ease of the Customer Journey
How much effort do your customers have to put in to get what they need? The Customer Effort Score (CES) is designed to answer precisely that. It measures the ease of a specific interaction, from finding a product to making a return. The guiding principle is simple: customers who have an easy time stick around.
The question usually sounds something like this: "To what extent do you agree or disagree with the following statement: The company made it easy for me to handle my issue."
Imagine these scenarios:
- Evaluating a return process: A high-effort score tells you your returns portal is likely confusing or has too many steps, creating a frustrating experience.
- Assessing the checkout flow: If customers are struggling to complete a purchase, your CES will reflect that—and you're leaving money on the table.
Making things easy for your customers is one of the most powerful things you can do for loyalty. A difficult experience can wipe out all the goodwill you've built. In fact, research shows that 96% of customers with a high-effort interaction become more disloyal.
It's clear that customer perception is fragile. A recent study highlights this, noting that 21% of global brands saw their customer experience scores decline. The data reveals that simply having a loyalty program isn't enough; loyalty erodes when experiences lack effectiveness, ease, and emotional connection. Learn more about how even small CX improvements can preserve customer loyalty and prevent churn. This makes tracking sentiment not just a good idea, but a business necessity.
Tracking What Your Customers Actually Do
While I'm a big advocate for listening to what customers say, talk is one thing and action is another. True loyalty isn't just about glowing survey responses; it's about what people do. This is where behavioral metrics become your source of truth, showing you loyalty through cold, hard data.
These numbers cut through the noise. They reveal precisely how customers interact with your business, helping you pinpoint your VIPs and, just as importantly, spot those who are quietly drifting away. Analyzing purchasing habits uncovers powerful trends that sentiment alone could never tell you.
Unpacking Repeat Purchase Rate
One of the most straightforward, yet powerful, measures of loyalty is the Repeat Purchase Rate (RPR). It answers a simple but critical question: what percentage of your customers bother to come back for more? A high RPR is a fantastic sign that you're delivering an experience worth repeating.
The calculation itself is easy enough:
Repeat Purchase Rate = (Number of Customers with More Than One Purchase / Total Number of Customers) x 100
So, if you had 500 customers in a quarter and 150 of them came back for a second purchase, your RPR would be a solid 30%. That tells you nearly a third of your customer base saw enough value to buy again. But the real magic happens when you start segmenting this data.
Don’t just settle for the overall rate. Slice and dice it to find the stories hidden within:
- By Product Line: You might discover that customers who buy your flagship skincare serum have a 60% RPR, while those who only grab a promotional holiday gift set have an RPR of just 5%. This immediately tells you where to focus your retention marketing.
- By Customer Cohort: Look at the RPR for customers acquired during a specific campaign. Did the people who flooded in from your Black Friday sale stick around, or were they just one-and-done bargain hunters?
A subscription box I once worked with lived and died by this metric. A dip in RPR for a specific cohort was their canary in the coal mine—a warning that a recent change in product curation wasn't landing well. It gave them the chance to act with targeted offers before those customers hit the cancel button.
The Power Duo of Purchase Frequency and Order Value
While RPR tells you if customers return, it doesn't tell you how often they come back or how much they spend. For that, you need to look at two other crucial metrics: Purchase Frequency (PF) and Average Order Value (AOV).
Purchase Frequency (PF) is all about how many times an average customer buys from you in a set period. A coffee brand would want to see a high PF every month, whereas a mattress company would be looking at this over a span of years.
Average Order Value (AOV), on the other hand, tracks the average amount spent per order. It helps you understand if your loyalists are making small, frequent buys or large, infrequent ones.
These two work hand-in-hand to paint a much clearer picture. Think about the stories they tell:
| Customer Scenario | Purchase Frequency (PF) | Average Order Value (AOV) | The Story It Tells |
|---|---|---|---|
| The Enthusiast | High | Low | This customer is a fan who buys often but could be a great candidate for upselling or product bundling. |
| The Big Spender | Low | High | This person trusts you for major purchases. Your goal is to shorten the time between their big-ticket buys. |
| The Ideal Loyalist | High | High | This is your VIP. Nurture them with exclusive perks and early access to keep them happy. |
A retail client of mine used this to great effect. They found that one line of denim not only had a high RPR but also consistently boosted the AOV whenever it was in a customer's cart. It became the undeniable cornerstone of their catalog, shaping everything from inventory buys to marketing campaigns.
By tracking these behavioral metrics in your analytics platform, you're essentially building an early-warning system for customer health. A drop in purchase frequency from a once-loyal segment is a clear red flag. It’s your cue to re-engage them with a personalized touch—turning data into a strategy that keeps your best customers right where you want them.
So, you’ve got a handle on what your customers think and how they behave. Great. But how does that translate into actual dollars and cents? It's time to connect the dots between warm, fuzzy loyalty and the hard, cold numbers on your balance sheet.
When you can clearly show the financial impact of a happy customer, you're no longer just spending on retention—you're investing. This shift in perspective is what separates good marketing from great business strategy.
The Power of Customer Lifetime Value (CLV)
If there's one metric that truly tells this story, it's Customer Lifetime Value (CLV). In simple terms, CLV is a forecast of the total profit you can expect from a single customer throughout their entire relationship with your brand. It’s the ultimate report card for financial loyalty.
You don't need a data scientist to get started. A straightforward formula can give you a powerful baseline:
CLV = Average Purchase Value x Purchase Frequency x Customer Lifespan
Let's put that into a real-world context. Imagine your typical customer spends $75 per order, comes back 4 times a year, and sticks around for about 3 years. Their estimated CLV is a cool $900. Suddenly, that $20 loyalty bonus you were hesitant to offer seems like a no-brainer, doesn't it? It's a small price to pay to protect a $900 asset.
Once you know your CLV, you can start answering some of the toughest business questions:
- How much should we really be spending to acquire a new customer?
- Which of our customer segments are actually the most profitable in the long run?
- Where can we allocate our retention budget to get the biggest bang for our buck?
This is where a tool like Toki becomes incredibly useful. By segmenting your audience based on CLV, you can design tiered reward programs. Your highest-value customers get the best perks, which makes them feel seen and valued—and gives them every reason to stay loyal.
This chart illustrates how data from a simple satisfaction survey can be tracked and analyzed, providing crucial insights that fuel loyalty and, ultimately, CLV.
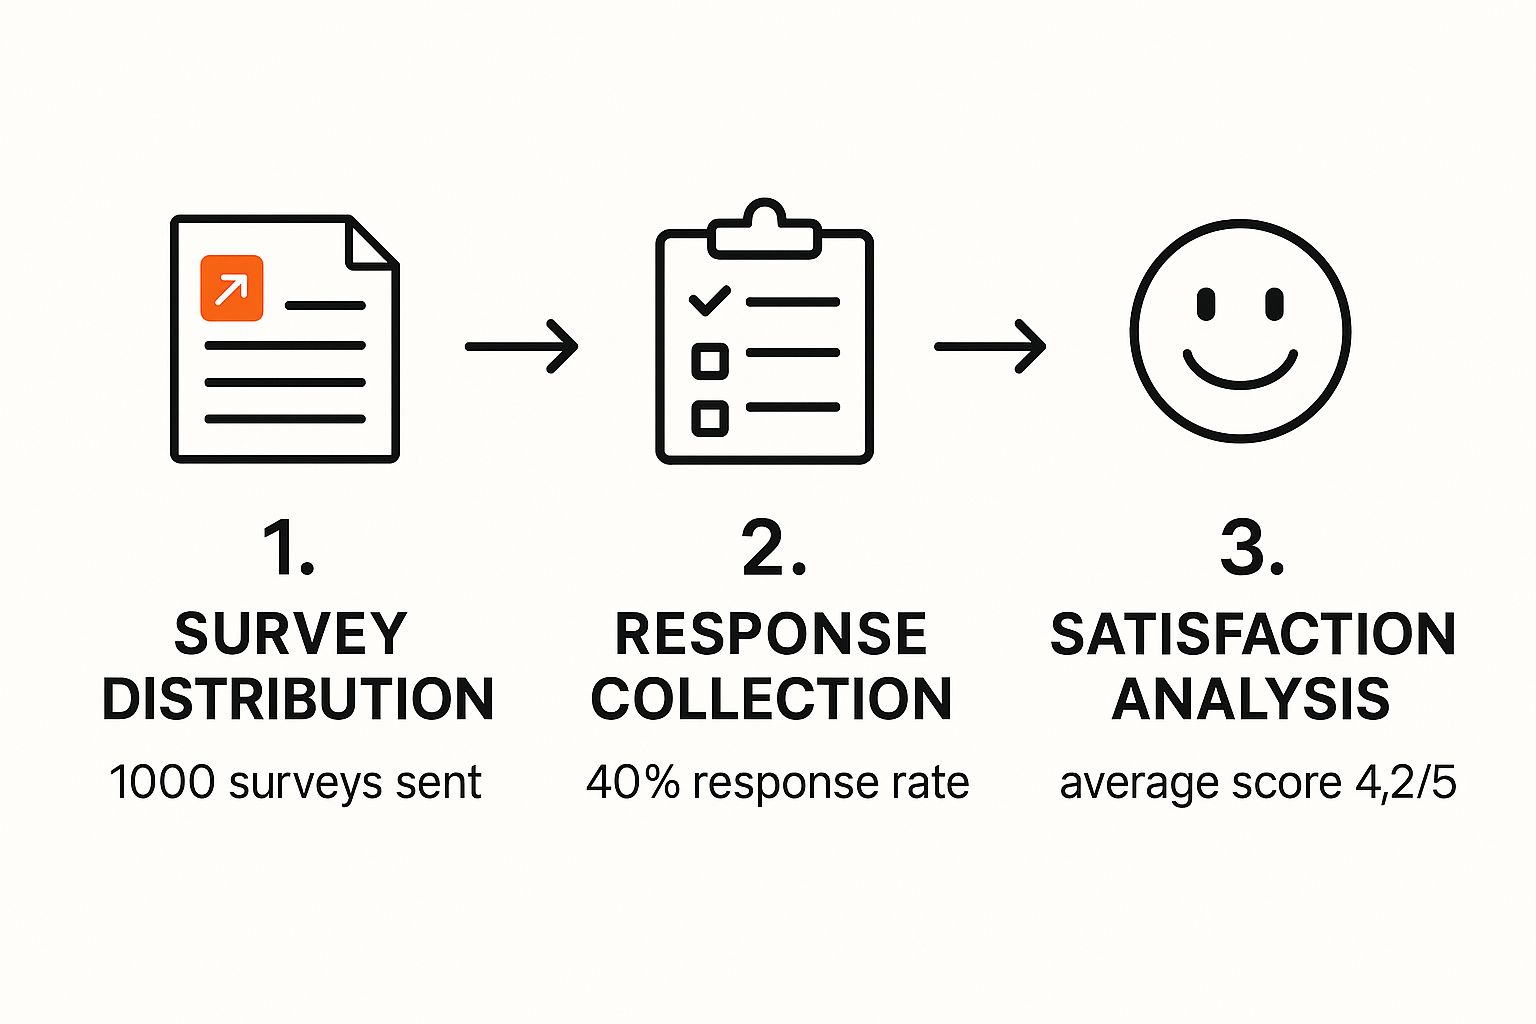
Here, the strong response rate and high satisfaction scores signal a healthy customer base ripe for nurturing, which is a fantastic leading indicator for future CLV growth.
Beyond the Sale: Measuring True Engagement
But hold on—loyalty isn't just about who spends the most. Some of your most powerful brand advocates might not have the highest CLV. They're the ones shouting you out on social media, leaving glowing five-star reviews, and convincing their friends to buy from you. CLV alone misses this massive contribution.
That’s why smart businesses create a Customer Engagement Score (CES). This is a custom-built metric that tracks valuable interactions that aren't purchases. It gives you a much richer picture of a customer's total relationship with your brand.
Building your own CES is all about assigning points to the actions you want to encourage:
- Leaving a product review (20 points)
- Referring a new customer who buys something (50 points)
- Tagging your brand on Instagram (10 points)
- Opening your weekly newsletter (5 points)
- Logging into their account on your app (5 points)
When you track these scores, you start to uncover hidden gems: customers with a modest CLV but off-the-charts engagement. These are your superfans, your future brand ambassadors. They're the people you should be inviting to VIP events or asking for testimonials.
Combining CLV with a Customer Engagement Score gives you that coveted 360-degree view of what loyalty truly means for your business.
Research based on 230 million member actions reveals just how nuanced modern loyalty is. While groups like Millennials show high allegiance (73% express loyalty), today’s shoppers demand genuine value and personalization in exchange for their business and their data. This makes it critical to track both financial worth (CLV) and active engagement (CES) to build truly resilient customer relationships. You can dive deeper into these findings in Antavo’s comprehensive global report on customer loyalty.
Knowing who your most valuable and engaged customers are is the first, crucial step. After that, it's all about putting the right strategies in motion to keep them happy and active.
By implementing proven customer retention strategies, you can turn these metrics from numbers on a dashboard into sustainable, long-term growth. Tying loyalty to your bottom line isn't just an accounting trick; it’s how you build a stronger, more customer-focused brand that can weather any storm.
Turning Loyalty Data Into Actionable Strategies
Collecting loyalty data is one thing. Actually using it is where the magic happens. Your NPS, CLV, and repeat purchase rates are more than just numbers on a screen; they're direct signals from your customers telling you what they want. If you're not turning that data into concrete action, you're missing the entire point.
A good strategy creates a powerful feedback loop. You measure, you act, you measure again, and you refine. This is how you move from simply tracking loyalty to actively building it, one customer at a time.
Build Your Loyalty Command Center
First things first: you need to get all your metrics in one place. Juggling tabs between your NPS software, your e-commerce platform, and a messy spreadsheet for CLV is a recipe for frustration. It makes it nearly impossible to connect the dots.
This is where a unified dashboard, like the one built right into Toki, becomes your command center. It gives you a real-time, at-a-glance pulse of your customer base.
A well-built dashboard should let you answer critical questions instantly:
- Is our NPS score climbing or dipping this quarter?
- What’s the repeat purchase rate for customers we acquired during the holiday sale?
- Which customer segment delivers the highest lifetime value?
- Are engagement scores taking a hit for a specific product line?
When you see these data points side-by-side, powerful patterns emerge. Maybe you spot that a dip in NPS consistently happens two weeks before the same group of customers stops buying. That’s a predictive insight you can jump on before they churn.
Move From Generic Discounts to Smart Rewards
With a clear view of your data, you can finally ditch the one-size-fits-all rewards. Sure, a generic 10% off coupon is easy, but it’s rarely effective. You end up rewarding one-time shoppers who were never coming back anyway, while your best customers get a reward that feels… well, generic.
Let your customers’ behavior and feedback be your guide. Stop guessing what they want and start listening to what their actions are telling you.
Key Takeaway: The best loyalty programs don't treat everyone the same. They use data to segment customers and personalize the experience, making each person feel seen and valued. This is how a simple rewards system becomes a genuine relationship-building tool.
Think of a local coffee shop. They might see from their data that a small group of regulars always buys a pastry with their morning latte. Instead of a generic "buy 10 get one free" coffee card, they could offer a surprise "free pastry" reward after their fifth latte-and-pastry combo. It’s specific, personal, and shows they're paying attention.
Find the Right Mix of Perks
A truly great loyalty strategy blends different types of rewards to appeal to different motivations. Your data is the perfect cheat sheet for finding this mix.
-
Transactional Rewards: This is your classic points-for-purchase system. It’s fantastic for encouraging repeat business and building habits. Look at your Repeat Purchase Rate and Purchase Frequency to fine-tune this. If your average customer buys every 45 days, you can design a points challenge that rewards them for making a purchase within 30 days.
-
Experiential Rewards: These are the perks that money can't buy. They make customers feel like true insiders. We're talking early access to new products, invites to members-only workshops, or even a "skip the line" pass during busy seasons. Your Customer Engagement Score and feedback from NPS Promoters are goldmines here. If your biggest fans always rave about your unique product designs, give them an exclusive preview of the next collection.
Personalize Rewards Based on True Value
The ultimate goal is to tailor rewards based on a customer's total contribution—not just what they spend, but how they engage with your brand. Combining CLV with Engagement Score is how you get there.
Here’s a practical way to segment your customers and decide what to do next:
| Customer Segment | CLV | Engagement Score | Your Next Move |
|---|---|---|---|
| Your VIPs | High | High | Roll out the red carpet. Give them exclusive access, personal thank-you notes, and the best points multipliers. |
| Quiet Big Spenders | High | Low | These customers love your products but aren't part of the community. Nudge them with a bonus for their first review. |
| Vocal Advocates | Low | High | They might not be your biggest spenders, but their word-of-mouth is priceless. Reward them for referrals and feature their content. |
| At-Risk Customers | Declining | Declining | Act fast. Their activity is dropping. Send a personalized "we miss you" offer based on past purchases before they're gone for good. |
This segmented approach ensures you’re putting your resources where they’ll make the biggest difference. You stop wasting margin on flighty shoppers and focus your best efforts on keeping your most valuable people happy. And remember, knowing how to measure the success of a loyalty program is crucial for making sure these strategies are actually working over the long term.
Got Questions About Measuring Customer Loyalty? We've Got Answers.

Once you start digging into loyalty metrics, a few common (and important) questions always seem to pop up. It's one thing to know what the metrics are, but it's another to apply them with confidence in the real world. Let’s clear up some of the most frequent questions I hear about how to measure customer loyalty.
How Often Should I Measure Metrics Like NPS?
The honest answer? There's no one-size-fits-all schedule. The right timing really hinges on what you’re measuring and your own business cycle.
Think of it this way: for big-picture, relationship-focused metrics like Net Promoter Score (NPS), a quarterly or even semi-annual pulse check is usually perfect. You're looking for shifts in overall brand perception, and those things don't change overnight. This cadence gives you enough time to see if your efforts are moving the needle without burning out your customers on surveys.
On the flip side, transactional metrics demand immediate feedback.
- Customer Satisfaction (CSAT): Ask for feedback right after a key moment, like when a customer completes a purchase or after you’ve closed a support ticket.
- Customer Effort Score (CES): This is best sent right after a customer navigates a specific process, like finalizing a product return or updating their account info.
Behavioral data like Repeat Purchase Rate is something you should have a constant eye on. I recommend tracking it on a rolling monthly or quarterly basis to get a continuous read on the health of your customer base.
What’s Actually a Good Net Promoter Score?
This is the million-dollar question, and the real answer is: it depends entirely on your industry. A "good" NPS in retail might be just okay in the software world.
That said, here are some general benchmarks to give you a sense of where you stand:
- Above 0: This is the bare minimum. It means you have more Promoters than Detractors.
- Above 20: Now you’re in “favorable” territory. It's a solid sign of a healthy customer base.
- Above 50: This is where you hit “excellent” status, indicating powerful customer allegiance.
- Above 80: This is world-class territory, reserved for brands with incredibly passionate fans.
Here’s what really matters: your own score from last quarter. The most important benchmark is your own progress. The goal should always be to continuously improve by turning Detractors into Passives and Passives into Promoters.
Can I Measure Loyalty Without a Formal Rewards Program?
Absolutely! In fact, you should be doing this already. True, organic loyalty is the result of an amazing customer experience, not just a points-and-perks program. A rewards system is a powerful tool to amplify existing loyalty, not create it from scratch.
You can get a surprisingly clear picture of customer affinity by tracking the core metrics we’ve covered. Things like Repeat Purchase Rate and Customer Lifetime Value tell you if people are sticking around because they genuinely want to. Metrics like NPS and CSAT tell you why they feel that way. These numbers measure the natural connection customers have with your brand, with or without a formal program in place.
If I Had to Pick Just One Metric, Which Is the Most Important?
While I’ll always advocate for a holistic view, if I were forced to start with just one, it would be Customer Lifetime Value (CLV). It’s incredibly powerful because it directly connects loyalty to your bottom line. CLV forces you to think about the long game—repeat purchases, average order value, and overall customer health. It answers the ultimate question: "What is a loyal customer actually worth to our business?"
Now, if you need a leading indicator of customer sentiment, NPS is the classic choice for its simplicity and predictive power. The best strategy, of course, combines a behavioral metric (like CLV) with an attitudinal one (like NPS). To see exactly how these numbers play off each other, check out our guide on the most essential customer retention metrics.
Ready to stop guessing and start growing? With Toki, you can track these critical loyalty metrics, build a rewards program that customers love, and turn your data into repeat sales. Start building lasting customer relationships today.