7 Key Customer Retention Metrics for E-commerce
Learn essential customer retention metrics like Churn Rate, CRR, NPS, CLV, Repeat Purchase Rate, CSAT, and Engagement Score to boost e-commerce loyalty and revenue.
Unlocking Customer Loyalty: The Power of Retention Metrics
Want to build a loyal customer base and boost profits? Tracking the right customer retention metrics is key. This listicle reveals seven essential metrics every e-commerce business should monitor. Learn how to calculate and utilize metrics like Customer Churn Rate, Customer Retention Rate, and Net Promoter Score (NPS) to understand customer behavior, identify pain points, and improve your retention strategy. Mastering these customer retention metrics empowers you to increase repeat purchases and maximize customer lifetime value.
1. Customer Churn Rate
Customer Churn Rate is a fundamental customer retention metric that measures the percentage of customers who stop using a company's products or services during a specific time period. This metric acts as a direct indicator of your customer retention effectiveness, providing valuable insights into the health of your business. Calculating churn is straightforward: divide the number of customers lost during a specific period by the total number of customers at the beginning of that period, then multiply by 100. For example, if you started the quarter with 1000 customers and lost 50, your churn rate would be 5%. This seemingly simple calculation provides crucial information about your business's ability to retain its customer base. A high churn rate signals potential problems with customer satisfaction, product-market fit, or your overall customer experience.

This metric deserves its place on any list of essential customer retention metrics due to its direct correlation with revenue and growth potential. A lower churn rate translates to higher customer lifetime value (CLTV) and more predictable revenue streams. Features such as the ability to segment churn rate by customer demographics, product lines, or regions provide granular insights, enabling businesses to pinpoint specific areas of improvement. Whether measured monthly, quarterly, or annually, tracking churn rate offers a consistent pulse on customer loyalty.
Pros:
- Simple to calculate and understand: The formula is straightforward and easy to implement, even for businesses with limited resources.
- Directly measures retention failure: It clearly quantifies the loss of customers, providing a clear picture of retention performance.
- Provides an early warning system for customer satisfaction issues: A rising churn rate can alert businesses to underlying problems with their products, services, or customer experience.
- Helps forecast revenue and growth potential: Understanding churn allows for more accurate revenue projections and informs growth strategies.
Cons:
- Doesn't explain why customers are leaving: While churn rate highlights the problem, it doesn't explain the underlying reasons for customer attrition.
- May fluctuate seasonally in some industries, requiring careful analysis: Seasonal trends can influence churn, making it essential to analyze data within the context of industry-specific cycles.
- Different business models have different 'acceptable' churn rates: What constitutes a "good" churn rate varies depending on the industry and business model.
- Doesn't account for the value of customers lost: Losing high-value customers has a greater impact than losing lower-value ones, a nuance not captured by the basic churn rate calculation.
Examples of Successful Implementation:
- Netflix: Reports churn rates quarterly to investors as a key performance indicator, demonstrating its focus on customer retention.
- Spotify: Reduced its churn rate by improving personalization and content discovery features, demonstrating the impact of enhanced user experience.
- Salesforce: Maintains industry-leading retention with churn rates below 10%, setting a benchmark for SaaS businesses.
Actionable Tips for E-commerce Merchants, Startups, and Retail Brands:
- Track churn by customer segments: Identify patterns and tailor retention strategies to specific customer groups.
- Set industry-appropriate benchmarks: For SaaS businesses, an annual churn rate of 5-7% is often considered good. Research your industry to determine relevant benchmarks.
- Conduct exit interviews or surveys: Gather qualitative data to understand the reasons behind customer departures. Learn more about Customer Churn Rate for insights into common churn drivers.
- Use predictive analytics: Identify at-risk customers before they churn and implement proactive measures to retain them.
By diligently monitoring and analyzing your customer churn rate, you can gain valuable insights into your customers' behavior, identify areas for improvement, and ultimately build a more loyal and profitable customer base. This metric is especially crucial for subscription-based businesses and those focused on building long-term customer relationships.
2. Customer Retention Rate
Customer Retention Rate (CRR) is a crucial customer retention metric that measures the percentage of customers a company retains over a specific period. It provides a positive perspective on customer loyalty by focusing on those who stay with your business, rather than those who leave (churn). For Shopify and e-commerce merchants, D2C startups, retail brands, and subscription-based businesses, understanding and optimizing CRR is paramount for sustainable growth and profitability. Why does CRR deserve a place on this list? Simply put, retaining existing customers is significantly cheaper and often more profitable than acquiring new ones.
How it Works and Why it Matters
CRR helps businesses understand the effectiveness of their customer retention strategies. It's calculated using the following formula:
((Customers at end of period - New customers acquired during period) ÷ Customers at start of period) × 100
For example, if you started the quarter with 1000 customers, acquired 200 new customers, and ended the quarter with 1100 customers, your CRR would be ((1100 - 200) ÷ 1000) × 100 = 90%.
Analyzing CRR across different timeframes (monthly, quarterly, yearly) reveals trends and patterns in customer behavior. Furthermore, tracking CRR by cohort (customers acquired during the same period) allows for deeper insights into how retention varies based on acquisition channel, demographics, or product usage. This is particularly relevant for businesses employing tiered paid membership models.
Features and Benefits:
- Measures percentage of active customers: Provides a clear picture of customer loyalty.
- Analyzable across different timeframes: Allows for trend identification.
- Cohort analysis: Enables deeper understanding of customer behavior.
- Directly tied to revenue stability and growth: Retained customers contribute to recurring revenue.
- Validates customer satisfaction and experience efforts: High CRR suggests positive customer experience.
- Lower customer acquisition cost: Retention is 5-25x less expensive than acquisition.
Pros:
- Positive framing of customer loyalty.
- Direct link to revenue stability and growth.
- Validation of customer satisfaction efforts.
- Cost-effective compared to acquisition.
Cons:
- Can mask problems if not segmented (e.g., high overall CRR might hide low retention in a valuable customer segment).
- Doesn't account for customer profitability or value differences.
- Can be artificially inflated by contractual obligations (e.g., annual subscriptions).
- Requires a clear definition of an "active" customer.
Examples of Successful Implementation:
- Amazon Prime: Maintains ~93% annual retention through its comprehensive benefits ecosystem.
- Apple: Achieves iPhone retention rates above 90% through its integrated ecosystem and brand loyalty.
- American Express: Reports retention rates 2-3% higher than industry averages thanks to its rewards programs. These examples demonstrate how a focus on customer experience and value-added services can drive high CRR.
Actionable Tips for Improvement:
- Segment your analysis: Break down CRR by demographics, acquisition channels, and value tiers to identify areas for improvement.
- Track retention by cohort: Observe how retention trends change over time for different customer groups.
- Benchmark against industry averages: Compare your CRR to competitors and identify areas where you excel or need improvement. For subscription businesses, 75-85% is often a good benchmark.
- Analyze retention inflection points: Identify when customers are most likely to churn and implement targeted interventions. This could involve personalized email campaigns, exclusive offers, or loyalty programs.
- Leverage gamification and referrals: Engage customers through interactive experiences and encourage them to bring in new customers.
By focusing on Customer Retention Rate and implementing these strategies, businesses can build stronger customer relationships, drive sustainable growth, and maximize their return on investment. This is particularly crucial for e-commerce businesses operating on platforms like Shopify, where fostering customer loyalty translates directly into increased repeat purchases and higher lifetime value.
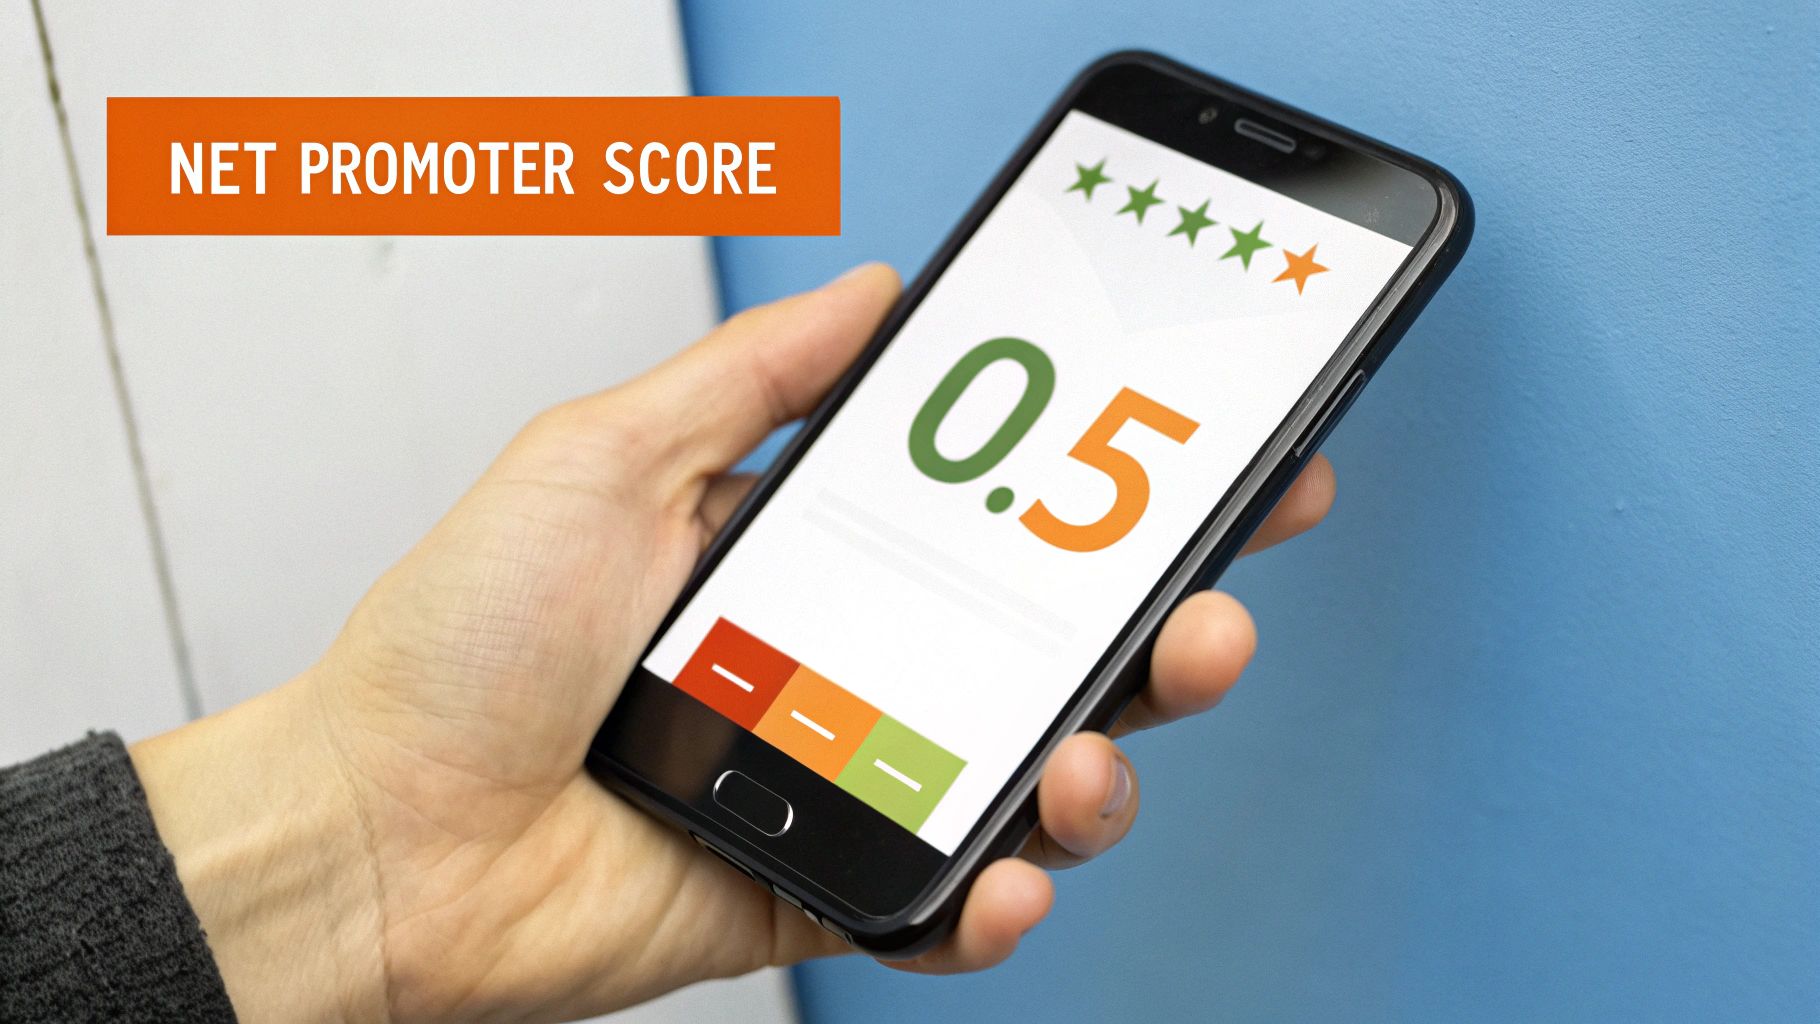
3. Net Promoter Score (NPS)
Net Promoter Score (NPS) is a crucial customer retention metric that gauges customer loyalty and their willingness to recommend a company's products or services. It boils down to a single, straightforward question: "How likely are you to recommend our company to a friend or colleague?" Customers respond on a scale of 0 to 10, and based on their answers, they are categorized into three groups: Promoters (9-10), Passives (7-8), and Detractors (0-6). NPS is then calculated by subtracting the percentage of Detractors from the percentage of Promoters, resulting in a score ranging from -100 to +100. This simple yet powerful metric provides a valuable snapshot of customer sentiment and predicts future business growth.
NPS deserves a place on any list of essential customer retention metrics because it directly correlates with customer loyalty and repeat business. Its simplicity makes it easy to implement and understand, allowing businesses of all sizes to track customer sentiment over time. For Shopify and e-commerce merchants, understanding NPS can be invaluable for identifying areas for improvement and building a loyal customer base. Direct-to-consumer startups can leverage NPS to establish strong customer relationships early on, while retail brands can use it to unify online and brick-and-mortar loyalty initiatives.
Features and Benefits:
- Simple, standardized scoring system: The 0-10 scale is universally understood and easy for customers to use.
- Trackable metric: NPS allows you to monitor changes in customer sentiment over time and assess the impact of your retention strategies.
- Qualitative insights: Including follow-up questions provides valuable context and helps understand the "why" behind the scores.
- Flexible measurement: NPS can be measured transactionally (after a purchase) or periodically (e.g., quarterly).
- Benchmarking: Compare your NPS against industry averages and competitors to identify areas for improvement.
Pros:
- Easy to understand and complete: High response rates are more likely due to the survey's brevity.
- Strong correlation with growth: A higher NPS often translates to increased customer lifetime value and revenue.
- Industry benchmarking: Gain insights into your performance relative to competitors.
- Actionable metric: NPS provides a clear indicator of customer sentiment and areas needing attention.
Cons:
- Limited depth without follow-up: The score alone doesn't reveal the reasons behind customer sentiment.
- Cultural variations: Scoring patterns can differ across cultures, requiring careful interpretation.
- Oversimplification: For complex customer relationships, NPS may not capture the full picture.
- Referral behavior discrepancy: High NPS doesn't always guarantee actual referrals.
Examples:
- Apple consistently achieves NPS scores above 70, demonstrating exceptional customer loyalty.
- USAA maintains NPS scores above 75 in financial services, significantly outperforming the industry average of around 35.
- Starbucks improved its NPS by 20 points after implementing its mobile rewards program, showcasing the impact of effective customer retention strategies.
Tips for Shopify and E-commerce Merchants:
- Close the loop: Don't just measure NPS; act on the feedback received. Reach out to Detractors to understand their concerns and address any issues. Thank Promoters for their loyalty and encourage referrals.
- Segment your audience: Analyze NPS by customer segments, product lines, and customer journey stages to identify specific areas for improvement.
- Consistent measurement: Conduct NPS surveys at regular intervals and after key interactions (e.g., purchases, customer service interactions) to track trends and identify areas needing immediate attention.
- Combine with other metrics: Integrate NPS with operational metrics like customer churn rate and customer lifetime value to gain a deeper understanding of the factors driving your scores.
By understanding and effectively utilizing NPS, e-commerce businesses can cultivate customer loyalty, drive repeat purchases, and ultimately achieve sustainable growth. It's a powerful tool for measuring and improving the customer experience, which is paramount in today's competitive online landscape.
4. Customer Lifetime Value (CLV)
Customer Lifetime Value (CLV) is a crucial customer retention metric representing the total revenue a business can expect from a single customer throughout their entire relationship. Understanding CLV helps companies determine how much they can invest in acquiring and retaining customers while maintaining profitability. It shifts the focus from individual transactions to the long-term value of fostering lasting customer relationships, a key component of any successful retention strategy. This metric provides invaluable insights into the overall health and potential of your customer base.

CLV can be calculated at both the individual customer level and for specific customer segments. It factors in key variables such as purchase frequency, average order value (AOV), and the average customer lifespan. A basic CLV calculation uses the formula: (Average Purchase Value × Purchase Frequency × Average Customer Lifespan). More advanced models incorporate customer retention rates and discount future revenue to account for the time value of money. For example, a customer who consistently purchases high-value items every month for several years will have a significantly higher CLV than a customer who makes a single small purchase.
Successful implementation of CLV analysis can be seen in companies like Starbucks, which estimates the CLV of its loyal customers at over $14,000 over a 20-year relationship. Similarly, Amazon recognizes the value of Prime members, who have an estimated CLV of $3,000 – more than double that of non-Prime customers. Even streaming giants like Netflix leverage CLV projections to optimize their content investments and subscriber retention efforts. These examples demonstrate how understanding and utilizing CLV can drive strategic decision-making across various industries.
Features and Benefits of using CLV as a customer retention metric:
- Measures long-term customer profitability: Provides a holistic view beyond immediate sales.
- Segmented analysis: Allows for identifying high-value customer groups and tailoring strategies accordingly.
- Strategic alignment: Informs marketing, product development, and customer support priorities.
- Emphasis on relationship building: Encourages a customer-centric approach focused on long-term engagement.
Pros:
- Provides strategic guidance for acquisition and retention investments.
- Helps identify the most valuable customer segments.
- Aligns marketing, product, and support priorities.
- Emphasizes long-term customer relationships over individual transactions.
Cons:
- Can be complex to calculate accurately, particularly for new businesses with limited historical data.
- Relies on projections and assumptions that may change over time.
- Historical data may not accurately predict future behavior in rapidly evolving markets.
- Different calculation methods can yield significantly different results.
Actionable Tips for Shopify and E-commerce Merchants:
- Start simple: Begin with basic CLV calculations and refine them as your data improves.
- CLV:CAC Ratio: Monitor your CLV to Customer Acquisition Cost (CAC) ratio. A ratio of at least 3:1 is generally considered healthy for sustainable growth.
- Segment by acquisition channel: Analyze CLV by acquisition channel to optimize your marketing spend and target high-value customers.
- Regular recalculations: Periodically recalculate your CLV as business conditions and customer behaviors change. This is especially important for businesses in dynamic markets.
- Loyalty programs: Implement loyalty programs to boost customer lifespan and purchase frequency. Learn more about Customer Lifetime Value (CLV)
CLV deserves a prominent place in your customer retention metrics toolkit because it provides a forward-looking perspective on customer value. By understanding CLV, businesses can make informed decisions about customer acquisition, retention strategies, and overall business growth. It allows you to prioritize efforts on acquiring and retaining high-value customers, leading to increased profitability and a sustainable business model.
5. Repeat Purchase Rate
Repeat Purchase Rate is a crucial customer retention metric that measures the percentage of customers who return to make additional purchases after their initial transaction. This metric deserves its place on this list because it provides a direct measure of customer loyalty and satisfaction, highlighting how effectively your business is converting one-time buyers into repeat customers. It's a core component of understanding your customer retention metrics and building a sustainable business. For Shopify and e-commerce merchants, direct-to-consumer startups, and retail brands, understanding and optimizing this metric is essential for long-term growth.
How it Works:
The Repeat Purchase Rate tracks how frequently customers return to buy your products or services within a specific timeframe. This timeframe is typically analyzed over 30, 90, or 365-day windows, allowing businesses to monitor short-term and long-term customer loyalty trends. The calculation is straightforward:
(Number of customers who purchased more than once ÷ Total number of customers) × 100
This metric can be further segmented by product category, customer cohort (e.g., customers acquired through a specific marketing campaign), or purchase channel (e.g., online vs. in-store) for a more granular analysis. This allows you to identify specific areas of strength and weakness in your retention strategy.
Features and Benefits:
- Tracks customer purchase frequency: Provides insights into how often customers return.
- Flexible timeframes: Analyze trends over 30, 90, or 365-day periods.
- Segmentable data: Break down the data by product, cohort, or channel.
- Directly reflects customer behavior: Measures actual purchases, not just expressed intent.
- Indicates product satisfaction and brand loyalty: High repeat purchase rates suggest positive experiences and a strong brand connection.
- Identifies growth opportunities: Pinpoints successful products and areas for improvement.
Pros and Cons:
Pros:
- Directly measures actual customer behavior rather than intent.
- Strong indicator of product satisfaction and brand loyalty.
- Helps identify product strengths and improvement opportunities.
- Correlates strongly with increased customer lifetime value.
Cons:
- Industry-specific purchase cycles affect interpretation (e.g., furniture vs. groceries).
- Doesn't account for purchase value or profitability.
- May be affected by seasonal or promotional patterns.
- Needs to be analyzed alongside purchase frequency metrics for context.
Examples of Successful Implementation:
- Amazon: Achieves repeat purchase rates exceeding 60% within 30 days for Prime members, showcasing the power of membership programs.
- Sephora: The Beauty Insider program drives repeat purchase rates over 80% annually through personalized rewards and exclusive access.
- Warby Parker: Reports that customers who make a second purchase have a 75% likelihood of making a third, highlighting the importance of driving that initial repeat purchase.
Actionable Tips:
- Track by cohort: Measure improvements in your retention strategies over time.
- Analyze time between purchases: Optimize remarketing timing and personalize messaging.
- Implement targeted incentives: Offer special discounts or exclusive access for first-to-second purchase conversion.
- Compare against industry benchmarks: A good starting point for e-commerce is 20-40%. Research your specific industry to understand typical repeat purchase rates.
- Use RFM (Recency, Frequency, Monetary) analysis: Segment customers for more targeted retention campaigns.
- Learn more about Repeat Purchase Rate for strategic advice on rewarding repeat customers without sacrificing profitability. This is especially useful for subscription-based businesses and those interested in tiered paid membership models.
By focusing on improving your Repeat Purchase Rate, you can build a loyal customer base, drive sustainable growth, and maximize the lifetime value of your customers. This metric is a key indicator of your overall customer retention efforts and provides valuable insights into the effectiveness of your marketing and customer experience strategies.
6. Customer Satisfaction Score (CSAT)
Customer Satisfaction Score (CSAT) is a key customer retention metric that measures how satisfied customers are with a specific product, service, or interaction. It's a vital tool for understanding customer sentiment and identifying areas for improvement, directly impacting your ability to retain customers and foster loyalty. This makes CSAT a critical metric for anyone focused on customer retention, from Shopify and e-commerce merchants to retail brands and subscription-based businesses.
CSAT typically uses a scale of 1-5 or 1-10, asking customers to rate their satisfaction level. The question is often phrased simply, such as "How satisfied were you with your experience today?" The score itself is calculated as the percentage of respondents who selected the top satisfaction ratings (usually 4-5 on a 5-point scale). This provides immediate feedback on specific touchpoints in the customer journey.
How CSAT Works and Why It's Important for Retention:
CSAT surveys are often triggered by specific events, such as a purchase, a customer service interaction, or the completion of an online order. This event-triggered measurement provides granular insights into specific areas of the customer experience. By identifying pain points and areas of delight, businesses can proactively address issues, improve processes, and ultimately, increase customer retention. A high CSAT score generally correlates with higher customer loyalty and reduced churn.
Features and Benefits:
- Event-triggered measurement: Captures feedback at crucial moments in the customer journey.
- Simple question format: Ensures high response rates and ease of understanding.
- Immediate, actionable feedback: Allows for quick responses to customer issues and concerns.
- Flexible deployment: Can be used across various touchpoints, including email, website, and in-app surveys.
- Follow-up questions: Provide deeper qualitative insights into the reasons behind customer ratings.
Pros:
- Easy to implement and understand
- Provides immediate, actionable feedback
- High response rates due to simplicity
- Flexible timing and deployment
Cons:
- Subject to response bias (extreme satisfaction/dissatisfaction more likely to respond)
- Cultural differences in how people rate satisfaction
- Captures point-in-time sentiment, not overall relationship
- Emphasizes recent experiences over historical relationship
Examples of Successful Implementation:
- Apple: Uses CSAT surveys after Genius Bar appointments, maintaining scores above 90%, showcasing a commitment to excellent customer service.
- Zappos: Tracks CSAT after every customer service interaction, striving for 95%+ satisfaction, demonstrating a dedication to exceeding customer expectations.
- American Express: Improved CSAT by 10% after implementing real-time survey feedback loops with immediate issue resolution, illustrating the power of proactive customer service.
Actionable Tips for E-commerce and Retail Businesses:
- Keep surveys short (1-3 questions): Maximize completion rates by respecting your customers' time.
- Deploy surveys within 24 hours of interaction: Capture feedback while the experience is fresh in the customer's mind.
- Include open-ended questions: Gather qualitative insights beyond numerical ratings.
- Create action plans for different score ranges: Ensure appropriate follow-up, such as reaching out to customers with low scores.
- Analyze trends: Segment CSAT data by customer service agent, product category, or customer segment to identify patterns and areas for improvement.
By effectively utilizing CSAT, businesses can gain a deeper understanding of customer satisfaction, identify areas for improvement, and ultimately, build stronger customer relationships that drive retention and long-term loyalty. It's a powerful tool for anyone seeking to improve customer experience and foster a loyal customer base.
7. Customer Engagement Score
Customer Engagement Score (CES) is a powerful customer retention metric that provides a holistic view of how actively your customers interact with your business. Unlike simpler metrics that focus on single actions, CES combines multiple touchpoints—product usage, website visits, email opens, social media interactions, and more—to create a comprehensive picture of customer involvement and predict future behavior. This makes it a crucial tool for any business aiming to improve customer retention.
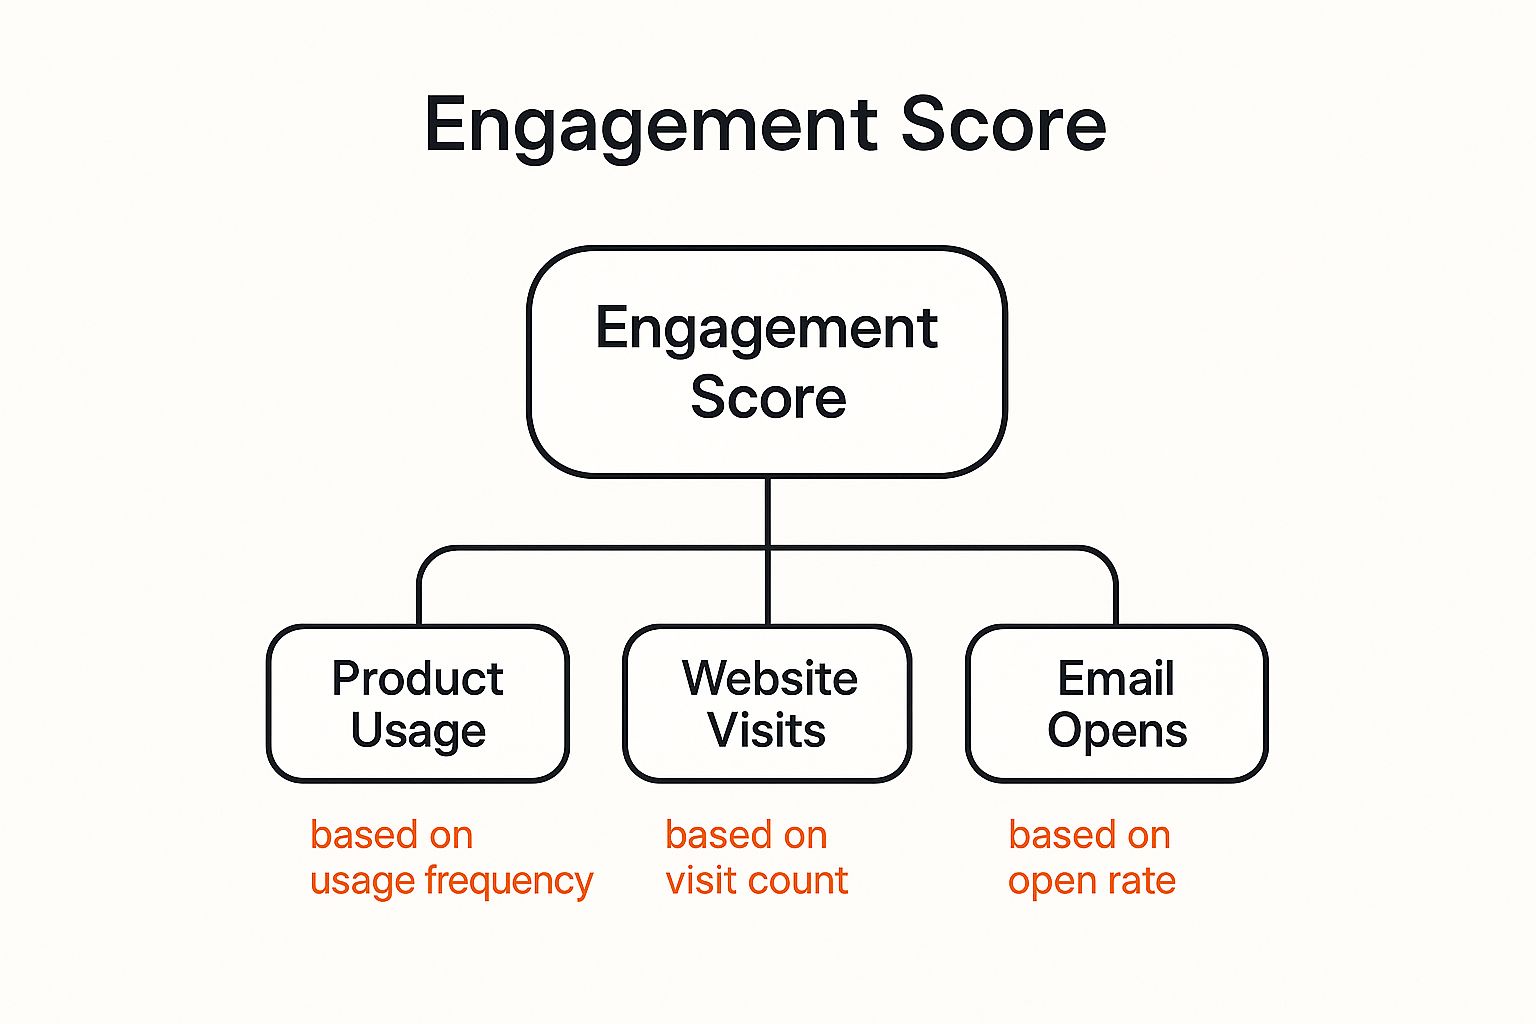
The infographic visualizes the key components of a Customer Engagement Score, placing "Customer Engagement" at the center. Radiating outwards are key contributing factors like "Product Usage," "Customer Service Interactions," "Marketing Engagement," and "Community Involvement." This illustrates how a comprehensive CES isn't solely based on product usage but also considers the entire customer journey and their interactions across various touchpoints. The thickness of the lines connecting the central concept to these contributing factors symbolically represents the relative weighting each factor might have in a specific CES calculation, emphasizing the customizable nature of this metric. The outer ring, displaying metrics like "Conversion Rate," "Retention Rate," and "Customer Lifetime Value," underscores the ultimate goal of tracking engagement: impacting these crucial business outcomes.
This metric deserves a place on this list because it's more predictive of retention than any single metric alone. By understanding the level of customer engagement, businesses can proactively identify at-risk customers, prioritize retention efforts, and even predict future buying behavior and expansion opportunities. This is particularly valuable for subscription businesses, e-commerce merchants, and any company reliant on repeat purchases.
Features and Benefits:
- Combines multiple interaction metrics: Provides a single, easily digestible score reflecting the overall health of the customer relationship.
- Customization: Tailor the score to your specific business model and customer journey, focusing on the interactions most relevant to your success. For Shopify merchants, this might include purchase frequency, average order value, and product reviews. For a SaaS business, it might prioritize feature usage, login frequency, and customer support interactions.
- Weighted scoring: Assign different weights to different activities based on their correlation with retention. For example, a repeat purchase might carry more weight than a single website visit.
- Recency, Frequency, and Depth (RFD): Incorporate not just how often customers interact but also how recently and how deeply they engage. A recent, frequent, and deep interaction signifies a much stronger relationship than sporadic, superficial engagement.
- Comparative scores: Present scores as percentiles or on a defined scale (0-100) for easy benchmarking and tracking progress.
Pros and Cons:
Pros:
- Comprehensive view of customer relationship strength.
- Early identification of at-risk customers.
- Prioritization of retention efforts.
- Prediction of future buying behavior.
- Superior predictive power compared to single metrics.
Cons:
- No standardized calculation method.
- Requires robust data integration and analysis.
- Can be complex to explain to stakeholders.
- Requires ongoing refinement as user behavior evolves.
Examples:
- Slack: Measures "Teams Actively Using Slack," combining message volume, feature usage, and user retention.
- Peloton: Tracks workout frequency, completion rates, and social interactions to predict subscription renewals.
- Spotify: Incorporates listening time, playlist creation, and feature exploration to personalize recommendations and enhance user experience.
Tips for Implementation:
- Start small: Begin with 3-5 key behaviors that indicate successful product adoption and strong customer engagement.
- Weight wisely: Base component weights on their correlation with retention – what actions truly predict long-term loyalty?
- Segment customers: Create engagement segments (highly engaged, moderately engaged, at-risk) to tailor retention strategies.
- Targeted campaigns: Design specific engagement campaigns for each segment. For example, offer personalized recommendations to highly engaged customers and re-engagement incentives to at-risk customers.
- Regular validation: Continuously monitor and validate that your CES correlates with actual retention outcomes.
By implementing a Customer Engagement Score, businesses gain a crucial advantage in understanding and influencing customer behavior, ultimately driving higher customer retention and lifetime value. This is particularly relevant for businesses in competitive markets, like Shopify merchants and direct-to-consumer startups, where building strong customer loyalty is paramount. Utilizing this metric empowers you to move beyond reactive retention strategies and proactively nurture valuable customer relationships.
7-Key Customer Retention Metrics Comparison
| Metric | Implementation Complexity 🔄 | Resource Requirements ⚡ | Expected Outcomes 📊 | Ideal Use Cases 💡 | Key Advantages ⭐ |
|---|---|---|---|---|---|
| Customer Churn Rate | Low - simple formula and calculation | Low - basic customer data needed | Identifies customer attrition rate and retention risks | Subscription services, SaaS, telecom | Easy to calculate; early warning on retention |
| Customer Retention Rate | Low to moderate - requires tracking cohorts | Moderate - data on new vs. retained customers | Measures customer loyalty and revenue stability | Subscription businesses, membership programs | Positive framing of loyalty; tied to growth |
| Net Promoter Score (NPS) | Low - standard survey method | Low to moderate - customer survey deployment | Gauges customer loyalty and likelihood to recommend | Customer experience feedback, benchmarking | Simple, widely recognized; benchmarking possible |
| Customer Lifetime Value (CLV) | High - complex calculations and projections | High - historical and predictive data needed | Estimates long-term customer profitability | Strategic marketing, budgeting, and investment decisions | Guides investment; identifies valuable segments |
| Repeat Purchase Rate | Low - straightforward ratio calculation | Low - purchase transaction data | Measures customer loyalty through repeat buying behavior | Retail, e-commerce, product-based businesses | Direct behavior metric; correlates with CLV |
| Customer Satisfaction Score (CSAT) | Low - simple surveys post-interaction | Low - frequent survey collection | Immediate feedback on customer experience | Customer service, support interactions | Fast, actionable feedback; high response rates |
| Customer Engagement Score | High - custom, composite metric | High - multi-source data integration | Holistic view of customer activity and risk prediction | SaaS, mobile apps, content platforms | Predictive of retention; identifies at-risk users |
Putting Retention Metrics to Work: Building a Loyal Customer Base
Mastering customer retention metrics is crucial for any business, especially in the competitive e-commerce landscape. From understanding your churn rate and customer lifetime value (CLV) to leveraging the insights provided by your Net Promoter Score (NPS) and customer satisfaction score (CSAT), these metrics provide a comprehensive view of your customer relationships. By analyzing repeat purchase rate and customer engagement score, you can identify areas for improvement and implement strategies to foster loyalty. The key takeaway here is that these metrics aren't just numbers; they are powerful tools that, when used effectively, can transform your business.
The true value lies in taking action. By actively monitoring these customer retention metrics, you can identify at-risk customers, personalize their experiences, and implement targeted campaigns that resonate. This proactive approach not only reduces churn but also increases CLV, driving sustainable growth and building a community of loyal customers who become brand advocates. For Shopify merchants, D2C startups, and retail brands alike, this translates to increased profitability, stronger brand recognition, and a competitive edge in the market.
Don't let your customer retention metrics gather dust in a spreadsheet. Transform them into actionable insights that drive real business growth. Ready to build stronger customer relationships and unlock the full potential of your retention strategy? Explore how Toki can help you implement effective loyalty programs, personalize rewards, and track your key customer retention metrics. Visit Toki today and start building a thriving, loyal customer base.