Customer Retention Rate Formula: Your Complete Success Guide
Master the customer retention rate formula with proven strategies from business leaders. Boost loyalty, predict growth, and transform customer relationships.
Why Smart Businesses Obsess Over Customer Retention

Imagine your business as a bucket. You're pouring in new customers like water, but there's a hole at the bottom. Some of that precious water is constantly leaking out. That leak represents customer churn, and even a small drip can lead to a big puddle of lost revenue over time. This is precisely why successful businesses pay close attention to the customer retention rate formula: it helps them identify and fix the leaks.
Let's compare two businesses. One has a 5% retention rate, the other a 95% retention rate. Imagine they both acquire new customers at the same rate. The second business, despite similar customer acquisition, will be drastically more profitable. Why? Because acquiring new customers is almost always more costly than keeping the ones you already have. It's like constantly refilling that leaky bucket instead of just patching the hole.
What's more, your retained customers become your biggest fans. They're not just sticking around; they're buying more, spending more per purchase, and telling their friends about you. This word-of-mouth marketing is incredibly valuable. It means focusing on retention isn't simply about minimizing losses – it’s a powerful engine for growth.
Calculating your retention rate with the customer retention rate formula offers crucial insights into the health of your business. It’s the first step toward cultivating a loyal customer base and creating a truly sustainable and profitable enterprise.
Mastering The Customer Retention Rate Formula
One of the most fundamental ways to measure customer loyalty and the overall health of your business is the Customer Retention Rate (CRR). Think of it as a vital sign, like a pulse, telling you how well you're keeping your valuable customers coming back.
This crucial metric is calculated with a straightforward formula: ((E - N) / S) x 100. Let's break it down piece by piece. "E" represents the number of customers you have at the end of a specific period (say, a month or a quarter). "N" stands for the number of new customers you acquired during that same period. Finally, "S" is the number of customers you had at the start of the period. This formula gives you a clear picture of how effectively your business is holding onto its existing customer base. Want a deeper dive? Learn more about calculating customer retention rate.
Let's illustrate this with a real-world example. Imagine you begin the quarter with 100 customers (S). Over the next three months, you gain 20 new customers (N) and finish the quarter with 110 customers (E). Using our formula, `((110 - 20) / 100) x 100 = 90%. This means you retained 90% of your original customers. For more examples and different scenarios, you might find this helpful: Customer retention rate calculation.
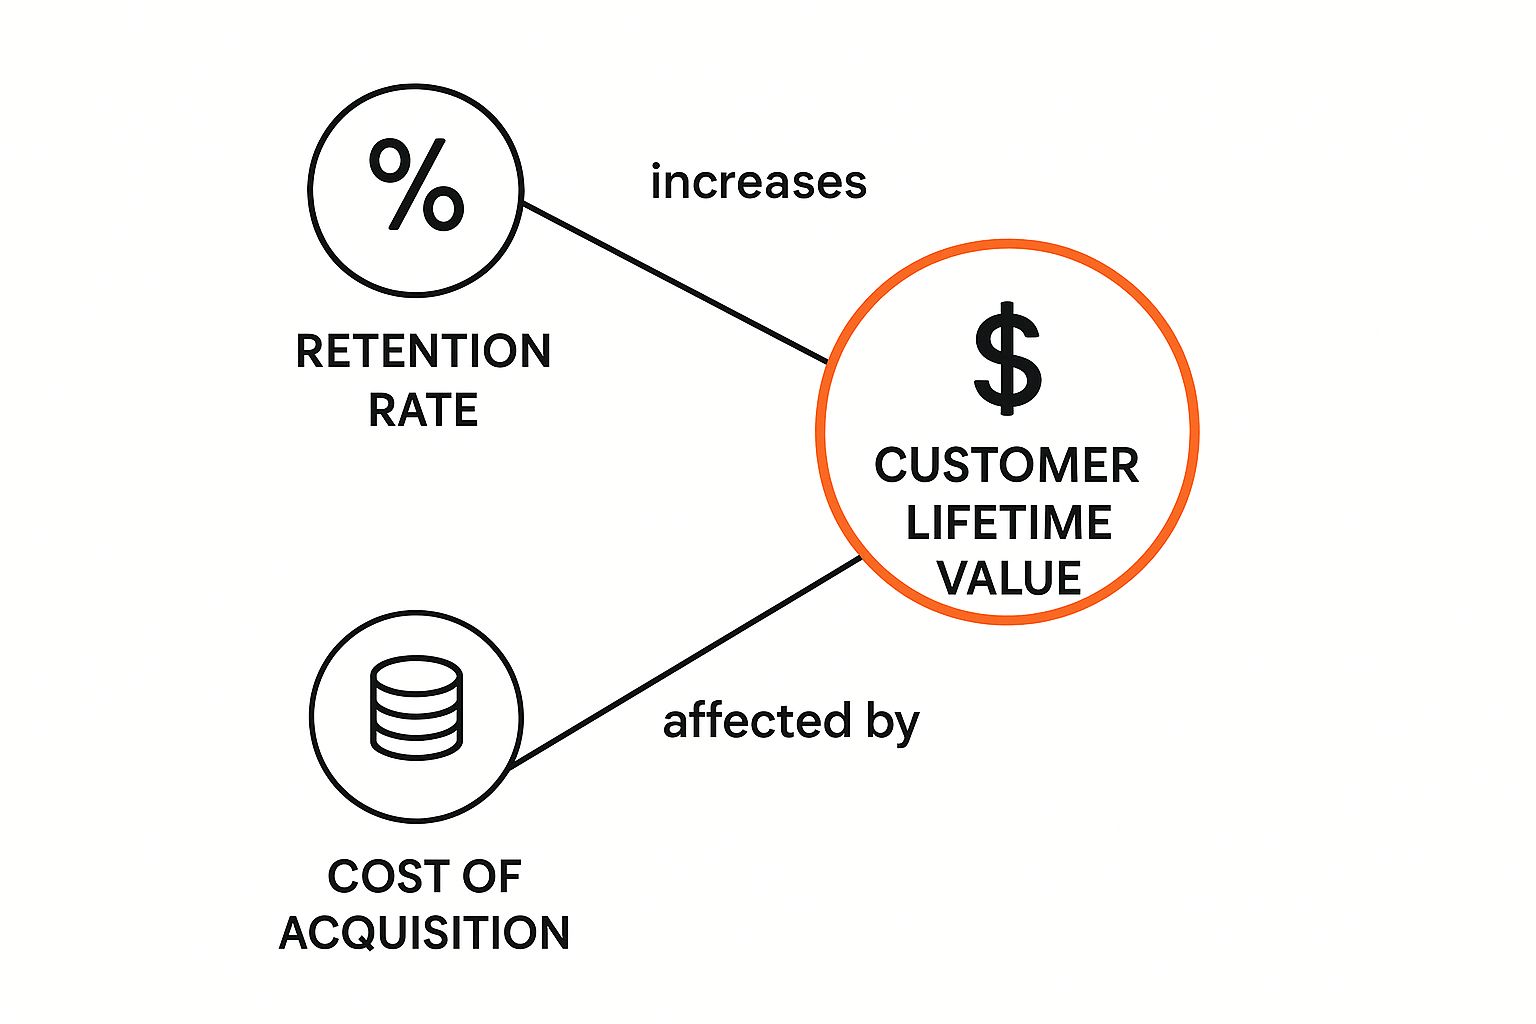
This infographic visually represents how retention rate, customer lifetime value, and cost of acquisition are all connected. It highlights how a higher retention rate boosts customer lifetime value, meaning customers spend more with you over the long haul. At the same time, a strong retention rate reduces the pressure to constantly acquire new customers, which can be expensive. Understanding this interconnectedness helps businesses prioritize strategies that build customer loyalty, leading to a more sustainable and profitable business.
To make the formula even clearer, let's examine each component in detail:
To help break down the formula further, here's a handy table:
Customer Retention Rate Formula Components A clear breakdown of each element in the retention rate formula with practical examples
| Component | Definition | Example Value | What It Tells You |
|---|---|---|---|
| S (Starting Customers) | The number of customers at the beginning of the period. | 100 | Your customer base at the outset. |
| N (New Customers) | The number of customers acquired during the period. | 20 | Your customer acquisition success. |
| E (Ending Customers) | The number of customers at the end of the period. | 110 | Your total customer base after considering both retention and acquisition. |
This table summarizes the key elements involved in calculating your CRR, offering a practical way to understand each component’s role. By understanding these building blocks, you're better equipped to interpret your CRR and use it to make informed business decisions.
Real Business Examples That Make Everything Click
Let's explore the customer retention rate formula with some real-world examples. Imagine a busy coffee shop. They begin January with 500 loyal customers (S). During the month, they gain 100 new customers (N), finishing January with 550 total customers (E).
Using the formula, ((550 - 100) / 500) x 100, we find a 90% retention rate. This tells us they held onto most of their regulars while adding new ones.
Exploring Different Scenarios
Now, picture a SaaS company providing project management software. They start the year with 2,000 subscribers (S). Over the year, they acquire 500 new subscribers (N) but finish with only 2,200 total subscribers (E). Their retention rate, calculated with ((2,200 - 500) / 2,000) x 100, is 85%. While gaining new customers, they also saw a dip in existing subscribers.
Let’s look at another example to solidify this. If a company starts with 100 customers, ends with 120, but 21 of those are new, the retention rate is ((120 - 21) / 100) x 100 = 99%. This calculation shows how well a company keeps its current customers, regardless of new acquisitions. For a deeper dive into this, check out this helpful resource on customer retention rate.
Finally, consider an e-commerce store selling handcrafted jewelry. Starting the quarter with 100 customers (S), they add 50 new customers (N), ending with 120 customers (E). Their customer retention rate is 70%, calculated using the same formula. This indicates a substantial portion of their initial customer base didn't make repeat purchases.
To see these calculations in action, let's examine the table below:
Customer Retention Rate Calculation Examples
Step-by-step calculations showing different business scenarios and their retention outcomes
| Business Type | Starting Customers | Ending Customers | New Customers | Retention Rate | Analysis |
|---|---|---|---|---|---|
| Coffee Shop | 500 | 550 | 100 | 90% | High retention, successful in keeping existing customers while acquiring new ones. |
| SaaS Company | 2,000 | 2,200 | 500 | 85% | Moderate retention, acquired new customers but lost a noticeable portion of existing ones. |
| E-commerce Store | 100 | 120 | 50 | 70% | Lower retention, indicating a significant loss of the initial customer base. |
As this table illustrates, different businesses experience varying retention rates. Understanding these differences is crucial for developing strategies to improve customer loyalty.
The Importance of Retention
These examples show how the same formula applies across different businesses and timeframes. It's a valuable tool for understanding customer behavior. You might also find these effective customer loyalty program examples helpful for boosting your own retention. Analyzing these scenarios highlights the importance of not just attracting new customers, but keeping your current ones happy and engaged.
Decoding What Your Numbers Really Mean

So, you’ve got a handle on the customer retention rate formula. Great! But now comes the real question: what story are these numbers telling? Think of your retention rate as a direct line of communication with your customers.
A high retention rate—generally speaking, anything above 85%—typically signals a healthy, thriving business with happy customers. It means you’re resonating with them. They appreciate your product, your service, and their overall experience. Keep up the good work!
But what if your retention rate is lower? Let’s say below 50%. This is a flashing warning light on your dashboard. It’s telling you something isn't quite right and needs attention. Maybe your product isn’t hitting the mark, your customer service could use a boost, or perhaps your pricing isn’t competitive. This is when it’s time to roll up your sleeves and investigate. Want to dive deeper into related metrics? Check out our guide on customer retention KPIs.
Interpreting Your Retention Rate in Context
Understanding your retention rate isn't a one-size-fits-all approach. It requires considering the nuances of your specific industry. For example, a 70% retention rate might be stellar for a company selling everyday consumer goods but cause concern for a subscription software business. Industry benchmarks vary, and knowing where your business stands in comparison offers valuable context.
Interestingly, a 100% retention rate isn’t always a cause for celebration. While it sounds perfect on paper, it might indicate a stagnant customer base or difficulty attracting new customers. A healthy business thrives on a balance of both retention and acquisition.
Another factor to consider is seasonality. Businesses experiencing peak seasons, like those in the holiday retail space, will likely see fluctuations in their retention rates throughout the year. Recognizing these patterns allows you to interpret your numbers accurately, avoiding unnecessary alarm or premature high-fives. By analyzing your retention rate over time and comparing it with industry benchmarks, you unlock crucial insights that can guide strategic decisions and propel business growth.
Avoiding Common Calculation Mistakes
Understanding the customer retention rate formula is key, but using it correctly is just as important. Think of it like baking a cake – you can have the best recipe (formula) in the world, but if you measure the ingredients wrong, the cake won't turn out right. Even small mistakes in your retention calculation can throw off your results and lead to decisions based on faulty information. Knowing which metrics to track is crucial. For a helpful overview, check out this resource on ecommerce metrics and benchmarks. Let’s explore some common traps and how to sidestep them.
Inconsistent Timeframes
Imagine trying to compare apples and oranges. One common mistake is using different timeframes for comparison. Calculating retention over a month, then comparing it to a quarterly rate, gives you a distorted picture. It's like comparing your running speed over a sprint with your speed over a marathon – they're just not comparable! Maintain consistent time periods—whether monthly, quarterly, or annually—for accurate comparisons.
Double-Counting Customers
Another pitfall is double-counting customers. If a customer buys from you multiple times within your chosen timeframe, they should only count once as a retained customer. Think of it like counting the number of people at a concert – you count each person once, not every time they clap or cheer. Tracking unique customers rather than transactions helps avoid this issue.
Ignoring Seasonality
Seasonal businesses often have peaks and valleys in customer activity. Comparing peak season retention with off-season numbers can be very misleading. It's like comparing swimsuit sales in July with those in January – the results will be skewed by the time of year. Account for these natural variations by comparing similar periods year over year. For example, compare this December’s retention with last December’s.
Misinterpreting 100% Retention
A 100% retention rate might seem fantastic, but it can sometimes be a red flag. It could mean your customer base is shrinking, or you’re struggling to attract new customers. A healthy business balances keeping existing customers happy with bringing new ones on board. Think of it like a leaky bucket – if you're only focused on stopping the leaks (retaining customers) but not adding any new water (acquiring new customers), the bucket will eventually run dry.
Proven Strategies For Boosting Customer Retention
Understanding the customer retention rate formula is the first step. But what comes next? How do businesses actually use this knowledge to improve their bottom line? Forward-thinking companies don't just calculate their retention rate – they use it as a springboard for strategic action. They combine retention tracking with customer segmentation, dividing their customer base into groups with similar behaviors and retention patterns. This allows them to tailor their approach and focus resources where they’ll have the biggest impact.
For example, imagine a business realizes their high-spending customers stick around much longer than budget-conscious shoppers. This insight could lead to a loyalty program specifically designed to reward and retain those high-value customers, strengthening their bond with the brand. Furthermore, behavioral analytics plays a vital role. By tracking how customers interact with their website or app, businesses get a clearer picture of what drives engagement and what leads to customers leaving.
This data then fuels personalized engagement strategies. Think of it like giving each customer exactly what they need, when they need it, through their preferred channel. Want to step up your engagement game? Tools like effective QR codes can open up a world of innovative possibilities.
Targeted Interventions and Proactive Customer Service
Personalized marketing is just one piece of the puzzle. Successful retention strategies often include targeted interventions. This could mean proactively reaching out to customers who seem to be losing interest, offering personalized support or exclusive deals to win them back. By identifying these at-risk customers early, businesses can stop churn in its tracks.
Proactive customer service is also essential. It's not just about reacting to complaints; it’s about anticipating customer needs and exceeding their expectations. Think of it as building a relationship, not just processing transactions. By 2025, businesses are increasingly turning to advanced analytics to power their customer retention strategies, using the CRR formula as a foundational metric. Companies are integrating data-driven approaches, combining the retention rate formula with customer segmentation, behavioral analytics, and personalized marketing to create a comprehensive retention plan. Learn more about how these strategies work together here. This proactive approach builds stronger customer relationships, boosting repeat business and positive word-of-mouth referrals.
Innovative Loyalty Programs and the Power of Toki
Innovative loyalty programs are another key driver of retention. These aren’t your run-of-the-mill discount programs. They offer personalized rewards, exclusive experiences, and a sense of community. Toki empowers businesses to create these highly effective loyalty programs, offering features like:
- Tiered memberships
- Referral programs
- Customizable reward systems
By integrating Toki, businesses can seamlessly track customer behavior, personalize rewards, and build lasting customer relationships that lead to more repeat sales. This combination of data-driven insights and personalized engagement is the secret to creating sustainable, profitable customer loyalty.
Your Action Plan For Retention Success
So, now we've explored the customer retention rate formula and why it matters. Let's talk about how to actually use these insights in your business. This isn’t just about the numbers; it's about turning data into a plan that gets results.
Setting Up Your Retention Measurement System
First things first: you need a reliable system to track your metrics. Pick a timeframe that works for your business—monthly, quarterly, or yearly. The key here is consistency. It's like regularly checking your car's oil—a small habit that prevents big problems later. Make sure you’re accurately recording the number of customers at the beginning and end of each period, along with the number of new customers you've gained.
This gives you the raw data you need to calculate your retention rate. From there, you can start to identify trends and areas for improvement.
Establishing Meaningful Benchmarks
Once your tracking system is in place, it's time to figure out what a "good" retention rate looks like for you. Comparing your rate to industry averages can help you see where you stand. For some strategies on boosting customer retention, check out this helpful resource: increase customer retention.
Keep in mind, a 75% retention rate might be fantastic in one industry but just average in another. Understanding your specific context is key.
Regularly Reviewing and Communicating Insights
Don't just calculate your retention rate and let it gather dust. Regularly review the data and share what you’ve learned with your team. This keeps everyone on the same page and working toward the same goals. Sharing successes, pinpointing challenges, and celebrating wins helps maintain momentum.
Setting Improvement Goals and Celebrating Success
Use your data to set challenging but achievable goals for improvement. Even a small boost in retention can have a big impact on your profits. And don’t forget to celebrate your wins! Recognizing and rewarding progress keeps your team motivated and reinforces the importance of customer retention.
By taking these steps, you transform the customer retention rate formula from a simple calculation into a powerful tool for sustainable growth.
Ready to take your customer relationships to the next level and boost repeat business? Check out Toki, the all-in-one loyalty platform designed to help you build lasting customer loyalty and unlock new revenue. Visit Toki today to learn more.