Mastering Client Retention Rate Calculation for E-commerce
Learn the client retention rate calculation for e-commerce. This guide offers proven formulas, cohort analysis, and strategies to boost repeat purchases.
If you want to get a real handle on calculating your client retention rate, you first need to appreciate its massive financial impact. This isn't just some fluffy metric to glance at; it's the very engine that powers sustainable growth. It's how you turn one-time buyers into profitable, long-term fans of your brand.
Why Retention Is Your E-commerce Growth Engine
So many e-commerce stores get stuck on a hamster wheel, pouring endless cash into ads just to attract new buyers. While bringing in new people is obviously important, focusing only on acquisition is like trying to fill a leaky bucket. The real path to profitability and a strong brand is plugging those leaks and keeping the customers you’ve already worked so hard to get.

This isn't just a hunch—the data is crystal clear. Study after study has shown that even a 5% bump in retention rates can double a company's profitability. On top of that, repeat customers spend, on average, 67% more than brand-new ones. The financial incentive to focus on keeping your existing customers is huge.
The Real Financial Impact on Your Store
Think about the compounding power of a single loyal customer. Someone who comes back to buy from you multiple times a year is infinitely more valuable to your bottom line than a handful of one-and-done shoppers. This is the heart of Customer Lifetime Value (CLV), a metric that absolutely skyrockets when you have solid retention.
When you build a dependable base of repeat customers, you create a far more predictable and stable revenue stream. This financial stability gives you the confidence to:
- Invest in growth initiatives like developing new products or trying out different marketing channels.
- Ride out market slumps or seasonal lulls because your loyal customers create a reliable sales floor.
- Cut back on expensive ad spend, which directly lowers your Customer Acquisition Cost (CAC).
A high retention rate is your competitive moat. It insulates your business from price wars and competitors because your customers aren't just buying a product—they're invested in your brand.
Building a Community of Brand Fans
The benefits go way beyond the balance sheet. Strong retention helps you build a genuine community around your brand. These loyal customers become your most authentic and effective marketing assets. They’re the ones leaving glowing reviews, telling their friends about you, and defending your brand on social media.
Just look at these advantages:
- Word-of-Mouth Marketing: A happy, returning customer is the most powerful advertisement you could ever ask for. Their organic recommendations are more trusted than any paid ad.
- Valuable Feedback Loop: Loyal customers are often more willing to give you honest feedback, which is pure gold for improving your products and overall experience.
- Higher Engagement: They’re the first to try your new products, join your loyalty program, and interact with your content.
Once you truly grasp the why behind retention, figuring out the how becomes a top priority. After you've nailed the calculation, you can start exploring powerful customer retention strategies to build your own loyal following. This guide will give you the tools you need to perform an accurate client retention rate calculation, turning this crucial metric into your North Star for growth.
The Core Formula for Calculating Client Retention
Before you can improve your retention, you need a solid way to measure it. Let's get right into the nuts and bolts.
While it might sound a bit technical, the standard formula for calculating client retention is actually pretty straightforward. It’s your foundational metric—a clear snapshot that tells you how well you’re holding on to the customers you worked so hard to win in the first place.
Here’s the formula you’ll be using:
Client Retention Rate = [ (CE - CN) / CS ] * 100
I know, letters and brackets can look intimidating. But don't worry, each symbol represents a simple number you can easily pull from your e-commerce platform's data. Let's break down exactly what they mean for your store.
The Formula’s Key Ingredients
To get an accurate calculation, you first need to understand the three main components. Think of them as the essential ingredients for measuring customer loyalty over a specific period you've defined.
- CS (Customers at Start): This is simply the total number of unique customers you had on the very first day of your chosen timeframe. If you’re calculating for June, this would be your customer count on June 1st.
- CE (Customers at End): This is your total unique customer count on the last day of that same period. For that same June calculation, this is your customer count on June 30th.
- CN (New Customers): This one is crucial—it's the total number of brand-new customers you acquired during that timeframe. These are the folks who made their very first purchase between your start and end dates.
It’s absolutely critical to subtract your new customers (CN) from your end-of-period total (CE). Why? Because this step isolates the customers you started with, which is the whole point. If you included new buyers, your rate would be artificially inflated, giving you a false sense of security.
The core idea is simple: From the pool of customers you had at the beginning of the month, how many were still with you by the end? The formula is designed to answer precisely that question.
To make this crystal clear, here’s a quick reference table that breaks down each part of the formula.
Client Retention Rate Formula Components
This table demystifies each variable in the standard retention formula, providing a simple definition for e-commerce store owners.
| Variable | Symbol | Definition |
|---|---|---|
| Customers at Start | CS | The total number of customers you had on day one of your measurement period. |
| Customers at End | CE | The total number of customers you had on the final day of the measurement period. |
| New Customers | CN | The total number of customers who made their first-ever purchase during the period. |
With these definitions in hand, the formula becomes much less abstract and far more practical for everyday use.
A Real-World Example: A Shopify Skincare Store
Theory is great, but let's see how this works in practice.
Imagine you run an online store called "Glow & Grow Skincare" on Shopify and want to figure out your client retention for the month of April.
First, you’ll need to pull the numbers from your store's analytics:
- Customers at Start (CS): On April 1st, your records show you had 5,000 total customers.
- Customers at End (CE): By April 30th, your total customer count grew to 5,400.
- New Customers (CN): Throughout April, you acquired 600 brand-new customers.
Now, let's plug these values into the formula.
First, you need to find out how many of your existing customers stuck around. To do that, subtract the new customers from your final count.
(CE - CN) = 5,400 - 600 = 4,800
So, of the 5,400 customers you had on April 30th, 4,800 of them were from your original pool.
Next, divide that number by the number of customers you started with to see what percentage of the original group remained.
4,800 / CS = 4,800 / 5,000 = 0.96
Finally, just multiply by 100 to turn that decimal into a clean percentage.
0.96 * 100 = 96%
There you have it. The client retention rate for Glow & Grow Skincare for April was 96%. This tells you that 96% of the customers you had at the start of the month were still active by the end. The other 4% churned. This single number is your launchpad for much deeper analysis.
Uncovering Deeper Insights with Cohort Analysis
The standard client retention rate formula gives you a solid, high-level snapshot of your business's health. But that’s all it is—a snapshot. It averages out all your customers, hiding the powerful stories and trends happening just beneath the surface. To truly get a feel for customer behavior, you have to move beyond that single metric and dig into cohort analysis.
So, what’s a cohort? It's just a group of customers who share a common characteristic. For e-commerce retention, the most useful characteristic is usually time. Specifically, a cohort is a group of customers who all made their first purchase during the same period, whether that's a week, a month, or a quarter.
Think of it this way: instead of lumping everyone together, you're creating distinct groups. You might have a "January 2024 Cohort," a "Black Friday Week Cohort," or a "Summer Sale Cohort." Analyzing these groups separately is how you uncover your most valuable insights.
This diagram breaks down the basic flow of customers we use when calculating retention.
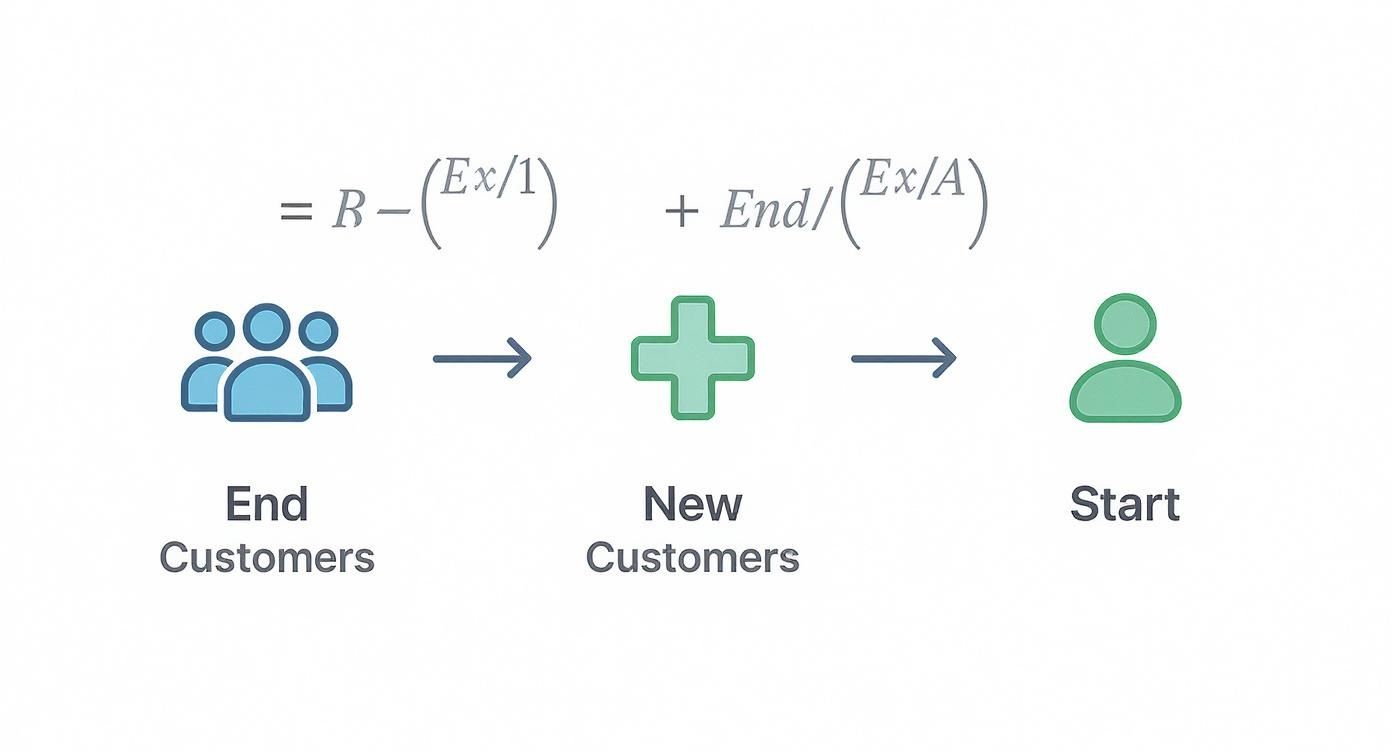
The formula zeroes in on your existing customer base by removing new acquisitions from the final count. This gives you a true picture of loyalty over time.
Why Cohorts Reveal the Real Story
Calculating retention for specific cohorts lets you answer much more sophisticated questions about your business. You can finally see the real, long-term impact of specific actions and events.
For example, did the customers you acquired during that expensive Black Friday campaign stick around longer than the ones from a regular Tuesday email blast? Cohort analysis will tell you. Maybe you find that your holiday shoppers are low-value, one-time buyers, while customers acquired in February have a much higher lifetime value.
This level of detail is a game-changer for your marketing strategy. It helps you understand things like:
- Marketing Channel Quality: Which channels bring in the "stickiest" customers?
- Product Impact: Does the first product a customer buys influence how long they stay?
- Onboarding Success: Did changes to your welcome email series actually improve long-term retention for new cohorts?
By segmenting customers into cohorts, you move from a blurry, averaged-out picture to a high-definition view of customer loyalty. You can see precisely when and why different groups of customers churn, empowering you to take targeted action.
Interpreting a Cohort Retention Table
The most common way to visualize this data is with a cohort retention table. It might look a little intimidating at first, but it's incredibly powerful once you know how to read it.
Imagine a table where each row represents a different cohort (say, customers who first bought in January, February, March). The columns represent the months following their initial purchase (Month 1, Month 2, and so on). The cells show the percentage of each cohort that came back to make another purchase in a given month.
You might see that your January cohort has a 60% retention rate in Month 1, which drops to 45% in Month 2. By comparing this row to the others, you can spot trends. Perhaps a new feature you launched in March led to a significantly higher Month 1 retention rate for the March cohort compared to previous months. If you want to dive deeper, our guide on what cohort analysis is provides a complete walkthrough.
Retention Benchmarks Across Industries
Retention isn't a one-size-fits-all metric; it varies dramatically by industry. For instance, Software-as-a-Service (SaaS) and enterprise software have unique usage patterns that heavily influence their retention figures.
Industry benchmarks show that only about 39% of SaaS users are still active after one month, a number that dips to around 30% by the three-month mark. The variation within software is also significant; software for manufacturing and consumer goods tends to enjoy better user retention, while tools for the financial and government sectors often struggle to keep users engaged past the first month.
By understanding these benchmarks, you can set more realistic goals for your e-commerce business. A subscription box service will naturally have a different retention profile than a store selling high-end furniture. The key is to compare your cohort performance against relevant industry standards and, more importantly, against your own historical performance. This detailed approach to client retention is your best tool for continuous improvement.
How to Calculate Retention with Your Own Tools
Knowing the formulas is a great start, but the real magic happens when you apply them to your own sales data. Let's get our hands dirty and move from theory to practice. The good news is you don't need a fancy, expensive platform to get started—the tools you already have are more than capable.
Here, I'll walk you through the practical, copy-pasteable formulas and queries you need to calculate your retention rate using Google Sheets, Excel, and SQL. This is all about bridging the gap between understanding the concept and actually getting actionable numbers from your store's data.
Calculating Retention in Excel or Google Sheets
For most e-commerce merchants, a simple spreadsheet is the perfect place to begin. They’re accessible, familiar, and surprisingly powerful for this kind of analysis. The most important part is getting your data structured correctly.
First, you'll need an export of your customer list. The absolute essentials are a unique customer ID and the date of their first purchase. This is the foundation that allows you to group customers into cohorts and see who comes back.
Let's imagine you have your data organized in three columns:
- Column A: Customer ID
- Column B: Date of First Purchase
- Column C: Date of Last Purchase
To calculate your basic retention rate for a specific period, like Q1, you can use a simple formula. Let's say your customer data lives in cells A2:C5000. You would first define your start date (let's put it in cell E1) and your end date (in cell F1).
The COUNTIFS function is your best friend here. For instance, to find your Customers at the Start (CS), you just need to count every customer whose first purchase was on or before your start date.
=COUNTIFS(B2:B5000, "<="&E1)
You'd then use similar logic to count the other variables you need for the formula. It’s a bit of manual work, but doing this is a fantastic way to get a real feel for your data. Of course, if you find yourself doing this constantly, dedicated e-commerce analytics tools can automate a lot of this heavy lifting.
Using SQL for a Deeper Dive
If you have direct access to your store’s database—which is common for platforms like Magento or custom-built solutions—SQL is by far the fastest and most powerful way to calculate retention. A well-written query can pull precise cohort data in a matter of seconds.
The core idea is to join your customer table with your orders table. This allows you to pinpoint each customer's first purchase date and then track their subsequent activity over time.
Here’s a simplified SQL query you can adapt for your own use. This example calculates monthly cohort retention, showing you what percentage of customers from each month’s cohort returned to buy again in the following months.
WITH customer_cohorts AS ( SELECT customer_id, MIN(order_date) AS cohort_month FROM orders GROUP BY customer_id ), subsequent_orders AS ( SELECT o.customer_id, DATE_TRUNC('month', o.order_date) AS order_month FROM orders o JOIN customer_cohorts cc ON o.customer_id = cc.customer_id WHERE o.order_date >= cc.cohort_month ) SELECT DATE_TRUNC('month', cc.cohort_month) AS cohort, COUNT(DISTINCT s.customer_id) AS retained_customers FROM customer_cohorts cc LEFT JOIN subsequent_orders s ON cc.customer_id = s.customer_id GROUP BY 1 ORDER BY 1;
This query will give you the raw numbers needed to build a cohort table. From there, you can easily calculate the percentages for each month, which will reveal powerful trends about how customer loyalty evolves over their lifecycle with your brand.
Pro Tip: Don't let complex queries intimidate you. Start with something simple. Try pulling a list of all customers who made their first purchase in January, and then see how many of them show up in your February orders. Building your skills one step at a time is the way to go.
No matter which tool you pick, the objective is the same: turn raw sales data into a clear, meaningful metric. By calculating your retention rate, you're not just getting a number—you're creating a baseline. From there, you can track progress, test new strategies, and make smarter decisions that keep your customers coming back for more.
So, you’ve run the numbers and now you're staring at a single, powerful percentage. But what does it actually mean? Is your 75% retention rate something to celebrate, or is it a sign you’ve got a leaky bucket?
The honest answer: it depends entirely on your business.
There's no magic number for a "good" retention rate that works for every e-commerce store. Think about it—a brand selling handcrafted furniture that people buy once a decade will naturally have a different benchmark than a subscription box service that thrives on monthly repeat purchases. Your real goal isn't to chase a universal standard, but to figure out what's realistic for your niche and, more importantly, to focus on improving your own numbers over time.
Benchmarking Against Industry Averages
Context is everything. A great way to get your bearings is to see how your store stacks up against others in your industry. This simple comparison helps you set realistic goals and quickly gauge whether you're leading the pack or falling behind.
Client retention rates can vary wildly from one industry to the next, often reflecting the nature of the products sold and how customers interact with them. For instance, media and professional services often boast impressive retention rates as high as 84%, built on the back of stable, ongoing client relationships. On the other hand, the fiercely competitive hospitality and restaurant sectors hover around a much lower 55%, a number that underscores the constant battle to earn repeat business. If you want to dig deeper into these differences, this customer retention rate report from Exploding Topics is a great resource.
To give you a clearer picture, let's create a table to see how different industries compare.
Industry Benchmark Client Retention Rates
A comparative look at average client retention rates across various industries to help you benchmark your own performance.
| Industry | Average Retention Rate (%) |
|---|---|
| Media & Entertainment | 84% |
| Professional Services | 84% |
| IT Services | 81% |
| Financial Services & Insurance | 78% |
| SaaS | 77% |
| Retail & E-commerce | 63% |
| Hospitality, Travel & Restaurants | 55% |
As you can see, a 63% retention rate might seem low compared to IT services, but it's right on the money for the average e-commerce brand. This kind of context is crucial before you start making any big changes.
Here’s a quick look at how retention can differ across common e-commerce sectors:
- Fashion and Apparel: This space is notoriously competitive, with fast-changing trends constantly vying for customer attention. A rate around 25-30% is actually pretty solid here.
- Subscription Boxes: The entire model is built on repeat business, so the bar is set much higher. A good monthly retention rate can be anywhere from 80-95%.
- Electronics: These are typically high-ticket, infrequent purchases. A lower annual retention rate is expected, but loyalty often shows up in brand preference when it's time for an upgrade.
- Beauty and Cosmetics: Since these are consumable products, brands often aim for a retention rate of 55% or higher, encouraging loyal customers to restock their favorites regularly.
Spotting Trends In Your Own Data
While industry benchmarks are a helpful starting point, the most important comparison you can make is against yourself. When you track your retention rate over time, it transforms from a static number into a dynamic diagnostic tool for your business. The real magic happens when you start spotting trends and connecting them to specific actions you’ve taken.
Did your retention rate suddenly tank the month after you tweaked your shipping policy or raised prices? That’s a massive red flag that the change might have hurt customer loyalty.
On the flip side, did you see a sustained lift in retention for cohorts acquired after launching your new loyalty program with Toki? That’s a huge win, and it proves your strategy is working.
Think of your retention rate as your store's pulse. A steady, strong pulse indicates a healthy, growing business. A weak or erratic one tells you it’s time to look deeper and diagnose the underlying issues.
By consistently keeping an eye on this metric, you can shift from just reacting to problems to proactively building a business that customers genuinely love and want to come back to. To build out your dashboard, you’ll want to look beyond just one number. Our guide on the most important customer retention KPIs can help you create a more complete picture of customer loyalty.
Common Calculation Mistakes to Avoid
Calculating your client retention rate feels straightforward, but a few simple mistakes can throw your numbers way off. And if your data is wrong, the business decisions you make based on it will be wrong, too. I've seen brands chase the wrong problems simply because they tripped up on the basics.
Let's talk about the most common pitfall: choosing the wrong time frame. If you calculate retention daily, you'll drive yourself crazy with meaningless noise. On the other hand, waiting a full year to check in is far too slow to catch a problem before it spirals. For most e-commerce brands, monthly or quarterly calculations strike the right balance. This gives you a clear trend line without overreacting to a random slow week.
Another easy mistake is misclassifying your customers. The formula relies on a clean count of who is truly new. If you accidentally lump some returning buyers into your "new customers" bucket, you'll end up subtracting too many people from the equation. Your retention rate will look artificially low, and you might panic for no reason.
Key Takeaway: Your formula is only as good as the data you feed it. Before you even start, double-check how your e-commerce platform defines a "new" versus a "returning" customer. Make sure your inputs (CS, CE, and CN) are squeaky clean.
Forgetting to Segment Your Data
This is the big one. If you only look at your overall retention rate, you're missing the real story. A single, blended average can hide critical issues and opportunities that are stalling your growth.
Imagine your store's overall retention rate is a decent 65%. You might look at that number, shrug, and move on. But what if you dug a little deeper? Segmentation could reveal a completely different picture:
- Customers from organic search: This group might have a fantastic 80% retention rate. They found you because they were looking for exactly what you sell.
- Customers from a paid social media ad: This cohort, however, could have a terrible 20% retention rate. They likely clicked an ad for a specific sale and were never going to stick around.
Without segmenting, you'd be blind to this huge difference. You might keep throwing ad spend at a campaign that brings in one-and-done shoppers while neglecting the high-value channels that attract loyal customers.
Ultimately, a proper client retention rate calculation is more than just a math problem. It’s about being thoughtful with your data, picking the right time frame, and—most importantly—segmenting to find the insights that will actually help you grow. Avoiding these common slip-ups turns a simple metric into a powerful guide for your entire strategy.
Answering Your Top Retention Questions
Once you've got the formulas down, a few questions always pop up. Let's dig into the common ones I hear from merchants so you can put this metric to work with confidence.
How Often Should I Be Running These Numbers?
The right cadence really depends on your business, but for most e-commerce brands, monthly is the sweet spot. This gives you a regular pulse check on your efforts without getting bogged down by daily fluctuations.
Quarterly calculations are also incredibly useful for zooming out and seeing the bigger picture.
- Go monthly to see the direct results of a new marketing campaign, a special promotion, or a tweak you made to your website's user experience.
- Go quarterly to inform your higher-level strategy and get a clearer view of long-term loyalty trends.
I'd steer clear of weekly calculations. The data is usually too noisy to give you anything truly actionable.
What’s the Real Difference Between Retention and Churn?
Think of them as two sides of the same coin. They both measure customer loyalty, just from opposite angles.
- Retention Rate: This is the percentage of customers who stuck with you over a set period. It's your success metric.
- Churn Rate: This is the percentage of customers you lost in that same timeframe. It points to where things might be going wrong.
It’s simple math: if your retention rate for April was 96%, your churn rate was 4%. They will always add up to 100%. While both are important, framing your goal around retention often leads to more positive, proactive strategies.
A trap I see many fall into is obsessing over churn. Focusing on retention shifts your mindset from "Why did they leave?" to "What makes them stay?" It’s a subtle but powerful change.
Should I Be Aiming for 100% Retention?
Honestly? No. While it's a nice thought, a 100% retention rate is a myth in e-commerce. Life happens. Customers move, their financial situations change, or they simply don't need your product anymore. These are things you can't control.
Instead of chasing an impossible number, focus on setting a healthy, realistic benchmark for your industry and working to improve it quarter over quarter. A consistently strong retention rate is the true sign of a healthy, sustainable business—not a perfect one.
Ready to turn those retention numbers into loyal, repeat customers? Toki provides all the tools you need, from loyalty and referral programs to paid memberships, to build a brand your customers will love. Start building your community today.