Customer Churn Analysis: Boost Retention & Reduce Loss
Discover effective customer churn analysis strategies to retain customers and grow your business. Learn how to turn exits into loyalty today!
Understanding Customer Churn Analysis Beyond The Basics
Customer churn analysis is more than just counting lost customers. It's about understanding why they leave. It's about digging deeper into the factors that contribute to their decision. This shift in perspective allows businesses to proactively address issues and cultivate stronger customer relationships. This involves examining behavioral signals and predicting potential churn months in advance. For example, a decrease in product usage or an increase in support tickets could signal a dissatisfied customer at risk of churning.
Voluntary Vs. Involuntary Churn: Knowing the Difference
A key aspect of churn analysis is distinguishing between voluntary churn, where the customer actively chooses to leave, and involuntary churn, where circumstances outside their control lead to service termination. Involuntary churn might occur due to expired credit cards or changes in a customer's location.
This differentiation is crucial because the strategies for addressing each type of churn vary. Understanding this allows businesses to tailor retention efforts effectively and allocate resources strategically.
The infographic below visualizes key data related to customer churn and average revenue per user (ARPU). It displays the monthly customer churn rate (%) and the corresponding ARPU for each month.
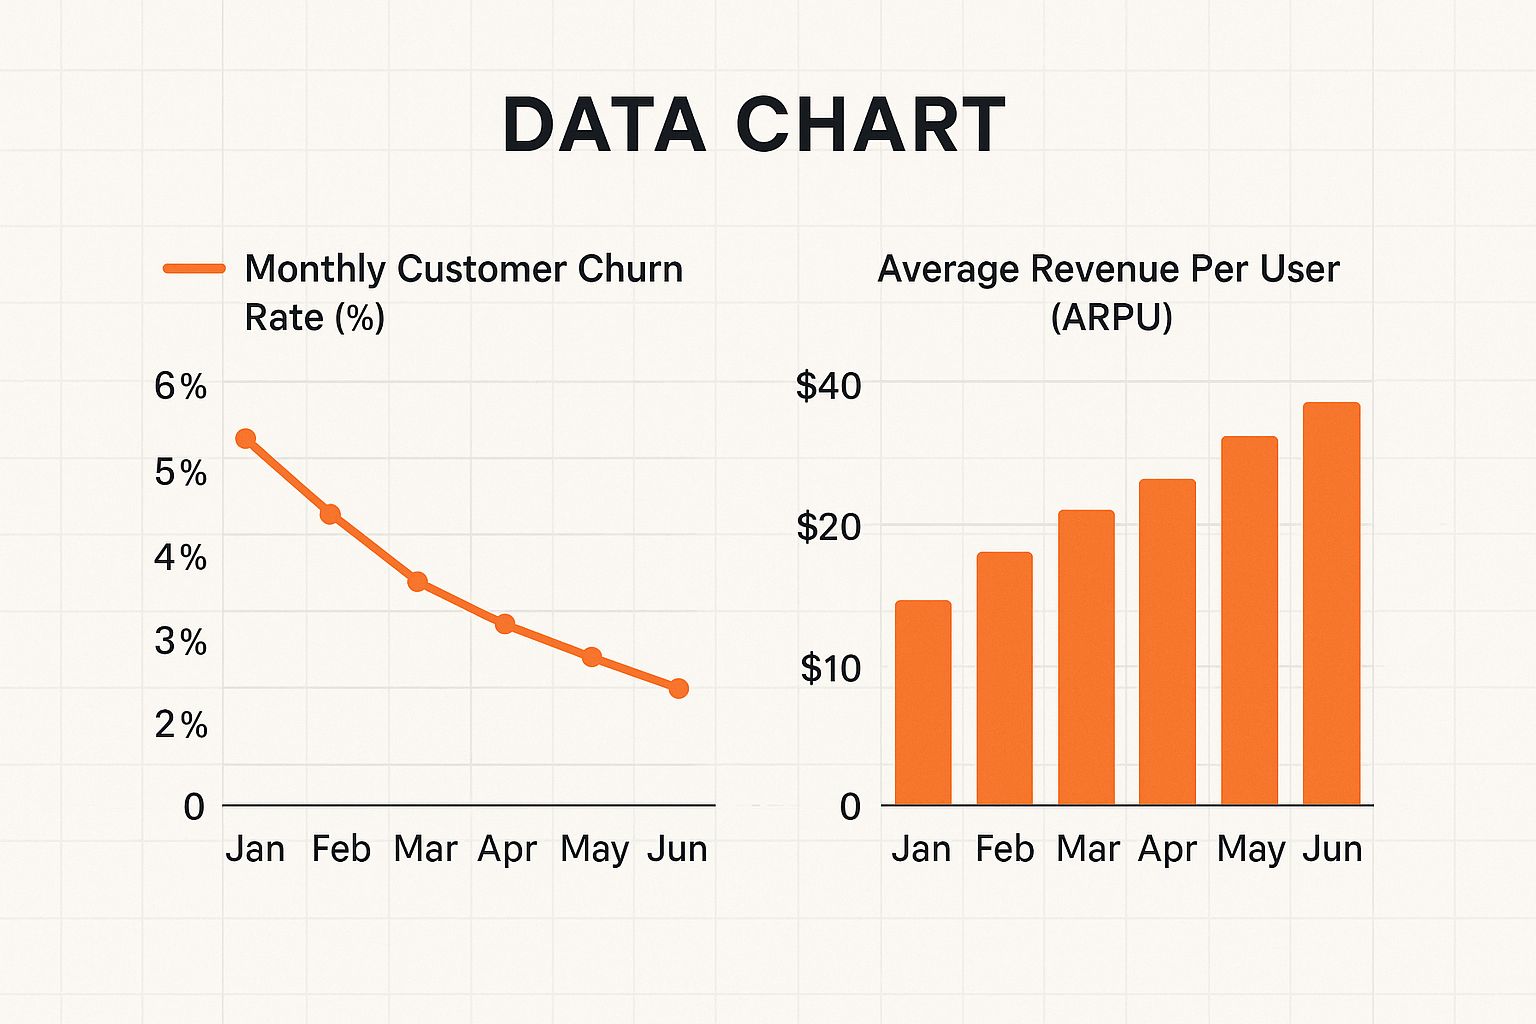
The months of April and May show a correlation between increased churn and decreased ARPU, suggesting a need for further investigation. This highlights the importance of proactively monitoring these metrics and taking action to mitigate potential losses. Customer retention is crucial, impacting both financial and operational aspects of a business. The average cost of losing a customer has increased from $9 a decade ago to $29 today. A mere 2% increase in retention can equal a 10% cost reduction. Acquiring a new customer is five times more expensive than retaining an existing one. For more detailed statistics, visit: Learn more about customer retention statistics.
To further illustrate the financial impact of customer retention, let's examine the costs across different industries. The table below compares average acquisition and retention costs, highlighting the return on investment (ROI) of churn analysis.
Customer Acquisition vs. Retention Costs by Industry
| Industry | Avg. Acquisition Cost | Avg. Retention Cost | Cost Ratio | Avg. Retention Rate |
|---|---|---|---|---|
| Software | $200 | $50 | 4:1 | 85% |
| Retail | $50 | $25 | 2:1 | 70% |
| Financial Services | $500 | $100 | 5:1 | 90% |
| Telecom | $100 | $30 | 3.33:1 | 80% |
As the table demonstrates, retention costs are consistently lower than acquisition costs across various industries. This underscores the importance of investing in churn analysis and proactive retention strategies. By understanding the why behind customer churn, businesses can optimize their efforts and maximize ROI.
Identifying The Early Warning Signs
Leading companies don't wait for customers to leave; they actively seek out early warning signs. This means monitoring not only obvious indicators like declining purchases but also subtle shifts in customer behavior. These shifts can include decreased website visits, lower engagement with marketing emails, or negative feedback on social media.
By identifying these early warning signs, businesses can intervene proactively and address customer concerns before they escalate into churn. This proactive approach transforms churn analysis from a reactive report into a strategic business tool, improving customer satisfaction and reducing churn.
Essential Metrics That Actually Predict Customer Behavior
Stop focusing on vanity metrics. Instead, let's explore the Key Performance Indicators (KPIs) that truly matter for customer churn analysis. These insights are drawn from real-world data from companies excelling at customer retention. For example, imagine trying to understand why your gym members are canceling. Simply counting the number of canceled memberships doesn’t tell you why they are leaving. Are they unhappy with the equipment, the classes, or the cleanliness?
Beyond Simple Churn Rate: Leading Indicators
While churn rate is a fundamental metric, it's a lagging indicator—telling you what already happened. To predict future churn, we need leading indicators. These metrics provide early warning signs. Think of it like a canary in a coal mine. Just as the canary’s distress signals danger, specific customer behaviors can foreshadow churn.
-
Customer Lifetime Value (CLTV): This metric predicts the total revenue a customer will generate throughout their relationship with your business. Incorporating churn probability into CLTV calculations makes this even more powerful for retention strategies. A declining CLTV can be an early indicator of churn.
-
Cohort Analysis: This involves grouping customers based on shared characteristics (e.g., acquisition date) and analyzing their behavior over time. This allows you to spot patterns within specific customer groups. For instance, if a particular cohort shows consistently higher churn than others, it’s a signal to investigate further.
Advanced Metrics: A Deep Dive Into Customer Behavior
Leading companies are using more sophisticated metrics to gain a deeper understanding of customer behavior. These provide actionable insights that drive retention strategies.
-
Customer Health Score: This metric assigns a score to each customer based on a combination of factors, such as product usage, engagement, and support interactions. Think of it like a patient’s vital signs. A low health score indicates a customer at risk of churning.
-
Behavioral Signals: These are subtle changes in customer behavior that can predict churn. For instance, decreased website visits, fewer app logins, or less frequent purchases can all be early warning signs. These signals are often overlooked but can be incredibly valuable when analyzed effectively.
The challenge of customer churn impacts both finances and operations. In B2B SaaS, the average churn rate is about 3.5%. SaaS companies typically retain only 39% of users after one month and 30% after three months. Understanding these benchmarks is crucial for effective retention planning. Find more detailed statistics here.
The following table provides industry-specific churn rate benchmarks and retention metrics to help businesses evaluate their performance.
Churn Rate Benchmarks by Industry and Business Model
| Industry/Sector | Average Monthly Churn | Average Annual Churn | Top Quartile Performance | Key Factors |
|---|---|---|---|---|
| B2B SaaS | 3.5% | 42% | <2% Monthly | Customer Success, Product Value |
| Streaming Services | 5-7% | 60-84% | <3% Monthly | Content Quality, Pricing |
| E-commerce | 2-4% | 24-48% | <1% Monthly | Personalized Recommendations, Loyalty Programs |
| Mobile Apps | 7-10% | 84-120% | <5% Monthly | User Engagement, App Performance |
Analyzing churn rates across different industries helps businesses understand where they stand in comparison to their competitors. Focusing on top quartile performance provides a target for improvement and highlights the key factors contributing to success.
Segmentation For Maximum Impact
Applying these metrics across all customers can be overwhelming and ineffective. Segmentation allows you to tailor your analysis and focus on specific customer groups. This allows for more targeted interventions.
For example, you might segment customers by their CLTV, their health score, or their engagement level. This allows you to focus resources where they will have the most impact. By segmenting your customer base and analyzing the appropriate metrics for each segment, you can create highly effective retention strategies. This targeted approach maximizes your chances of success and minimizes wasted effort.
Building Predictive Models That Actually Work
Customer churn analysis becomes truly powerful when you can predict departures before they happen. This section explores building predictive models that identify at-risk customers. We’ll cover a range of techniques, from simple logistic regression for smaller datasets to advanced ensemble methods used by enterprise-level companies.
Choosing the Right Model for Your Needs
Selecting the appropriate model depends on several factors, including the size of your dataset and the complexity of your customer behavior. For smaller datasets, logistic regression can provide a good starting point. This statistical method predicts the probability of an event (churn) based on a set of input variables.
For larger, more complex datasets, ensemble methods, which combine multiple models, often yield more accurate predictions. These methods, such as random forests and gradient boosting, can capture intricate relationships within the data that simpler models might miss. Think of it like using a team of specialized detectives instead of just one; each brings a unique perspective to solve the case.
Data Preparation and Feature Selection
The success of any predictive model hinges on the quality of the data. Collecting the right data is crucial. For example, demographic information, purchase history, website activity, and customer service interactions can all be valuable predictors of churn.
However, not all data is equally informative. Feature selection, the process of identifying the most relevant variables, is essential for building accurate models. Imagine trying to predict the weather based on factors like the color of cars or the number of squirrels in a park – irrelevant data adds noise and reduces accuracy.
Step-by-Step Model Building
Building a predictive model involves several key steps:
- Data Collection: Gather data from all relevant sources.
- Data Cleaning: Prepare the data by handling missing values and inconsistencies.
- Feature Engineering: Create new features from existing ones to improve model performance. For example, combine purchase frequency and average order value to create a "customer value" feature.
- Model Selection: Choose the appropriate model based on your data and business objectives.
- Model Training: Train the model using a portion of your data.
- Model Evaluation: Test the model's performance on a separate dataset.
- Model Deployment: Implement the model to predict churn and trigger interventions.
Real-World Examples and Common Mistakes
Many companies are successfully using predictive models to reduce churn. For example, streaming services use viewing habits and engagement metrics to identify subscribers at risk of canceling. Telecom companies analyze call records and data usage to predict customer attrition. You might be interested in: How to master ecommerce customer retention.
However, there are common modeling mistakes to avoid. One frequent error is overfitting, where the model performs well on the training data but poorly on new data. This is like memorizing the answers to a test instead of understanding the material. Another pitfall is neglecting to validate the model's performance in real-world scenarios. Regularly evaluating and adjusting your model is critical for maintaining accuracy and effectiveness. This iterative process ensures your predictive models remain relevant and provide valuable insights into your customer base.
Data Collection Strategies That Deliver Results
Effective customer churn analysis depends on gathering the right data from the right sources. This means looking beyond basic transaction data and exploring a wider range of customer information. This section explores proven techniques for collecting valuable insights across all customer touchpoints. These range from transaction patterns and support interactions to subtle, often overlooked behavioral signals.
Integrating Data From Multiple Sources
Successful companies don't rely on just one data source. They integrate information from a variety of platforms. These include Customer Relationship Management (CRM) systems like Salesforce, website analytics platforms like Google Analytics, marketing automation tools like HubSpot, and customer support platforms like Zendesk. This comprehensive view provides a more complete understanding of customer behavior and helps pinpoint potential churn risks.
For example, combining website activity data with purchase history can uncover valuable insights. A customer frequently visiting the pricing page but hasn't made a recent purchase might be considering switching to a competitor. This allows for proactive intervention, potentially saving the customer. Learn more in our article about key subscription retention strategies.
Handling Missing Information Strategically
Missing data points during the collection process are common. Instead of ignoring these gaps, successful companies use strategies to manage them effectively. These strategies might include using statistical methods to fill in missing values or building predictive models that can handle incomplete data. This ensures the analysis remains accurate and reliable.
Understanding why data is missing is also essential. Is it a technical problem, a shift in customer behavior, or something else entirely? Investigating these reasons can provide valuable insights and help improve data collection processes for the future.
Identifying Predictive Variables
Not all data is equally valuable. Some variables are better at predicting churn than others. Identifying these key variables is vital for building effective churn prediction models. This requires careful analysis and an understanding of the specific business context. For example, usage frequency might be a strong predictor for a SaaS company, while purchase recency might be more important for an e-commerce business.

Leveraging Structured and Unstructured Data
Leading organizations leverage both structured data (like transaction history and demographics) and unstructured data (such as customer feedback and social media posts) to gain a deeper understanding of churn. This combined approach provides a more nuanced perspective.
For example, transaction data might show a decrease in spending, while customer feedback could reveal the reason – dissatisfaction with a recent product update. This deeper understanding facilitates more targeted and effective retention strategies. By incorporating both types of data, businesses can build a more complete picture of customer behavior and develop better strategies for reducing churn. This ultimately allows for a more personalized and effective approach to customer retention.
Turning Insights Into Retention Strategies That Convert
Customer churn analysis provides the foundation for building effective retention strategies. However, analysis without action offers little value. This section explores how to transform your customer churn analysis insights into actionable strategies that generate tangible results.
Designing Targeted Interventions
By leveraging churn risk scores derived from your analysis, you can design targeted intervention campaigns. This means focusing your efforts on the customers most likely to churn. This targeted approach proves far more effective than generic campaigns that reach everyone, regardless of their churn risk.
For example, customers with high churn risk scores might receive personalized emails offering exclusive discounts. Proactive support calls can also address potential concerns. This allows you to allocate your resources efficiently and maximize your impact. This individualized attention can significantly improve customer satisfaction and reduce churn.
Personalized Retention Offers
Different customer segments have different needs and motivations. A one-size-fits-all retention strategy simply won't work. Your customer churn analysis can inform the development of personalized retention offers that resonate with each segment.
For instance, customers who value convenience might respond well to free shipping offers. Those who prioritize value might be more enticed by bundled discounts. This personalized approach ensures that you're offering the right incentives to the right customers, increasing the likelihood of retention. Check out our guide on calculating customer retention rate for more insights.
Automated Workflows
Responding quickly to early warning signs is critical for effective churn prevention. You can create automated workflows that trigger specific actions when these signs appear. This real-time response can be the difference between retaining a customer and losing them.
For example, if a customer's product usage drops significantly, an automated email can be sent offering assistance or reminding them of the product's benefits. If a customer submits a negative support ticket, an automated workflow can escalate the issue to a senior support agent for immediate attention.
Measuring Effectiveness
Finally, it's essential to establish frameworks for measuring the effectiveness of your retention initiatives. This continuous monitoring enables you to refine your strategies over time and ensure you're maximizing your ROI.
This involves tracking key metrics such as churn rate, customer lifetime value, and retention cost. By analyzing these metrics, you can determine which strategies are most effective and make data-driven decisions about future initiatives. This continuous improvement cycle ensures your retention efforts remain relevant and effective. Furthermore, understanding what works (and what doesn't) in different business contexts will help you create even more targeted and successful retention strategies. This allows you to adapt your approach based on specific industry dynamics and customer behaviors.
Tools And Technologies That Actually Matter

The right tools can significantly impact your customer churn analysis program. This section explores platforms and technologies that deliver real results, going beyond the hype. Choosing the right tools isn't about flashy features; it's about finding the best fit for your business size, technical capabilities, and analytical needs.
Choosing The Right Tools For Your Business
A wide range of tools exists, from established commercial platforms to flexible open-source options. Each has strengths and weaknesses concerning implementation time, integration challenges, and expected ROI. While enterprise platforms offer advanced features and robust analytics, they can be expensive and complex to implement. Smaller businesses might find simpler tools easier to use and integrate. Proactive customer engagement is crucial for combating churn. For effective tactics, learn more about how to improve customer retention.
Commercial Solutions Vs. Open-Source Alternatives
Commercial solutions typically provide a full suite of features, including data visualization, predictive modeling, and automated reporting. This convenience comes with a cost. Open-source alternatives require more technical expertise but offer greater flexibility and customization. They can be a cost-effective choice for businesses with in-house developers. This approach lets you tailor tools to your specific needs and seamlessly integrate them with existing systems.
AI-Powered Insights And Real-Time Analytics
Real-time analytics and AI-powered insights are changing how we analyze customer churn. Real-time analytics provides immediate insights into potential churn risks by tracking customer behavior as it happens. AI-powered tools can automate tasks like data analysis and predictive modeling, allowing your team to focus on strategy. It's important to understand the limitations of these technologies. AI isn’t a perfect solution; it requires careful implementation and ongoing monitoring to ensure accuracy and effectiveness.
Building Internal Capabilities
No matter which tools you choose, developing internal expertise is essential. Your team needs the skills and knowledge to use these tools effectively. This requires investing in training, establishing clear processes for data analysis, and fostering a data-driven culture. A strong understanding of your customer base and their behavior is also crucial for effective churn analysis, regardless of the specific tools used. This deeper understanding allows you to interpret data and develop targeted retention strategies.
Key Takeaways
Customer churn analysis is a crucial process for any business aiming for sustainable growth. It's not simply about identifying lost customers; it's about understanding the reasons behind their departure and leveraging that knowledge to boost retention. This understanding allows you to develop more robust predictive models and take proactive measures to keep your valuable customers engaged. This section outlines practical steps for success drawn from real-world applications.
Building a Strong Foundation
The initial step in effective customer churn analysis is creating a solid foundation. This involves several key components:
-
Defining Clear Objectives: What are your goals for churn analysis? Are you looking to reduce churn by a specific percentage, enhance customer lifetime value, or pinpoint particular pain points in the customer journey? Well-defined objectives provide crucial direction and focus.
-
Identifying Key Metrics: Track metrics aligned with your objectives. These could include churn rate, customer lifetime value, customer health scores, and behavioral signals. For implementing customer churn predictive models, consider exploring CRM workflow examples which can automate various tasks.
-
Data Collection: Gather data from all relevant sources, encompassing CRM systems like Salesforce, website analytics platforms like Google Analytics, and customer support interactions. This comprehensive approach provides a holistic view of the customer.
Developing Predictive Capabilities
With a solid foundation in place, you can begin predicting churn. This involves the following:
-
Building Predictive Models: Utilize statistical techniques such as logistic regression or more advanced methods like ensemble models to predict customer churn. The optimal model choice depends on your data's complexity and specific business objectives.
-
Feature Selection: Identify the most influential variables impacting churn. These may include demographics, purchase history, product usage, and customer service interactions. Selecting the right features enhances model accuracy and yields actionable insights.
-
Validation and Refinement: Continuously validate and refine your models. Customer behavior evolves, requiring your models to adapt. Regularly assess their performance and make necessary adjustments to maintain accuracy.
Turning Insights Into Action
The most critical step is translating your analysis into actionable retention strategies. This means:
-
Targeted Interventions: Concentrate your efforts on at-risk customers. Personalized emails, proactive support calls, and tailored offers can effectively prevent churn.
-
Cross-Functional Alignment: Share your insights across departments, including sales, marketing, and customer support. This collaborative approach ensures everyone works towards shared retention goals.
-
Feedback Loops: Implement feedback loops to learn from both successes and failures. Regularly evaluate your retention strategies and modify them based on performance. This continuous improvement cycle is essential for long-term success.
By focusing on these key takeaways, you can transform customer churn analysis from a reactive report into a proactive tool for growth. It's a continuous process of learning, adapting, and improving. This iterative approach empowers businesses to not only reduce churn but also cultivate stronger, more valuable customer relationships.
Ready to elevate your customer retention? Explore how Toki, the all-in-one loyalty platform, can help you build enduring customer relationships and boost repeat sales. Visit Toki today for more information.