Calculating Cost of Customer Acquisition a Guide
Master calculating cost of customer acquisition (CAC). This guide offers practical formulas, real-world examples, and proven strategies to reduce CAC.
Calculating your Customer Acquisition Cost is, at its core, pretty simple: divide your total sales and marketing costs by the number of new customers you brought in over a specific time. That's the basic formula, but mastering what goes into it is what separates the brands that thrive from those that just get by.
Why Mastering Customer Acquisition Cost Is Non-Negotiable
In a market this crowded, you can't afford to guess whether your marketing dollars are working. Understanding your Customer Acquisition Cost (CAC) isn't just a routine check-up; it's a vital sign for your entire business. We're not talking about some abstract theory here. This is about knowing, down to the dollar, how much you have to spend to get a new customer and, more importantly, if that investment is actually making you money.
This one metric has a ripple effect across your entire strategy, influencing everything from profitability to your ability to scale. Without a solid handle on it, you’re flying blind when making critical decisions.
- Budgeting: Where should you put your money? Which channels are actually pulling their weight and which are just a cash drain?
- Pricing: Are your products priced high enough to cover acquisition costs and still leave a healthy profit margin?
- Sustainability: Is your entire business model built to last, or is it on shaky ground?
The Rising Tide of Acquisition Costs
If you’ve been ignoring your CAC, now is the time to stop. The cost of getting a new customer in front of your brand has been climbing for years, and it's putting a serious squeeze on businesses everywhere.
The reality is stark: customer acquisition costs have surged dramatically. In just eight years, the average loss per new customer jumped by 222%, climbing from $9 in 2013 to a projected $29 by 2025. This trend highlights a growing challenge for brands trying to achieve profitable growth.
This isn't just a minor blip; it's a fundamental shift in the market. For ecommerce brands, it’s a particularly tough pill to swallow, with the average global CAC now sitting around $70. This upward creep means that sloppy spending that might have been okay a few years back can now sink your business. For a deeper dive into these numbers, you can check out the full customer acquisition statistics report.
Getting a handle on how to calculate the cost of customer acquisition gives you the clarity to navigate this tough environment. It turns a simple number into a powerful diagnostic tool. By digging into your CAC, you can spot wasteful spending, double down on the channels that are actually working, and build a more resilient, profitable business. It’s the first real step toward sustainable growth—moving beyond just acquiring customers to acquiring them profitably.
What Goes Into Your CAC? The Core Inputs
Before you can crunch the numbers, you need to be sure you're adding up the right things. A fuzzy understanding here leads to a useless CAC. We need to account for every single dollar spent on getting new customers through the door.
Here's a quick breakdown of what you absolutely need to include.
Core Components of Your CAC Calculation
| Component | Description | Examples |
|---|---|---|
| Ad Spend | The most direct cost. This is the total amount you spend on paid advertising campaigns. | Google Ads, Facebook & Instagram Ads, TikTok Ads, Pinterest Ads, affiliate commissions. |
| Salaries & Payroll | The cost of the people running your marketing and sales efforts. Don't forget this—it's often a huge expense. | Salaries for marketers, sales reps, content creators, and social media managers. |
| Tools & Software | The monthly or annual subscriptions for the technology that powers your marketing. | Email marketing platforms (e.g., Klaviyo), SEO tools (e.g., Ahrefs), CRM software, analytics platforms. |
| Content & Creative | The costs associated with producing the assets you use in your campaigns. | Freelance writers, graphic designers, video production costs, photoshoot expenses. |
| Overhead & Other | Any additional costs that are directly tied to your acquisition efforts. | Agency fees, PR retainers, influencer payments, marketing-related travel. |
Getting these inputs right is non-negotiable. If you leave out salaries or your software stack, you're not getting a true picture of your acquisition cost, and that can lead to some very expensive mistakes down the line.
Gathering Your Data for an Accurate CAC
Any CAC calculation is only as good as the numbers you feed into it. It’s the classic "garbage in, garbage out" scenario. If your inputs are shaky, your final CAC figure will be useless for making real business decisions. This initial data-gathering stage is honestly the most important part of the entire process.
First things first, you need to get a handle on your total sales and marketing expenses over a specific period—be it a month, a quarter, or a full year. And I mean total. This goes way beyond what you're spending on ads.
Identifying All Your Sales and Marketing Costs
So many businesses fall into the trap of only counting their direct ad spend from Google or Meta. That approach gives you a dangerously incomplete picture and a deceptively low CAC. To do this right, you have to track down every single dollar that supports your customer acquisition efforts.
This means you’ll need to pull reports from your accounting software, payroll systems, and various marketing platforms. A complete cost inventory should always include:
- Salaries and Benefits: The fully-loaded cost of your sales and marketing teams. Don't forget commissions, bonuses, and benefits—this is often the biggest "hidden" expense.
- Software and Tools: All those monthly subscriptions for your martech stack add up. We're talking about your CRM, email platform, SEO tools, analytics software, and everything in between.
- Agency and Freelancer Fees: Money paid to marketing agencies, SEO consultants, freelance writers, or graphic designers all belongs here.
- Creative Production: The cost of actually making the marketing materials, like video shoots, photography, or design work.
- Overhead Costs: A reasonable portion of office rent, utilities, and other overhead that can be attributed to your sales and marketing departments.
Getting these numbers right usually means getting your marketing, sales, and finance folks in the same room (or on the same call) to make sure nothing slips through the cracks. If you need help centralizing this information, you can explore some of the top ecommerce analytics tools that simplify data tracking.
Defining What Counts as a New Customer
Once your costs are tallied, you need to nail down the other side of the equation: how many new customers you actually acquired. This sounds simple, but a fuzzy definition here can throw your entire calculation off.
You have to set a clear, consistent rule for what a "new customer" means for your business. Is it someone making their very first purchase? What if they sign up for a free trial but haven't paid you a dime yet?
The key is to be consistent. Your definition of a "new customer" must align with your business model. For a SaaS company, it's typically the first paid subscription. For an e-commerce store, it's the first completed purchase.
Think through these common situations and decide how you'll handle them:
- Free Trial vs. Paid Conversion: If you offer a free trial, only count users once they become paying customers. Counting free sign-ups will make your CAC look artificially fantastic, but it’s not the truth.
- Returning Customer, New Product: Someone bought a t-shirt two years ago and just came back to buy a new line of jackets. Are they a new customer? Almost always, the answer is no. They're a returning customer, and the marketing that brought them back is a retention cost, not an acquisition cost.
- Lead vs. Customer: A lead is not a customer. It's tempting, but don't count every new email subscriber or demo request in your final number. Only count the people who have actually completed a transaction.
By meticulously tracking all your costs and setting a firm definition for a new customer, you build a foundation you can trust. This level of precision is what turns CAC from a vanity metric into a powerful tool for steering your company’s growth.
Let's Calculate CAC: A Real-World Example
Formulas are great, but they don't really come to life until you plug in some real numbers. So, let’s walk through a practical example together. We’ll follow a fictional B2B SaaS company, "Innovate Solutions Inc.," through one quarter to see exactly how this plays out.
The basic formula is straightforward: Total Sales & Marketing Spend / New Customers Acquired. The real trick, and where many people go wrong, is in tallying up every single dollar that goes into that "Total Spend" bucket.
Nailing Down the Quarterly Expenses
First things first, we need to round up all the costs Innovate Solutions racked up in Q3 (that’s July, August, and September) specifically for winning new business. A common rookie mistake is to only look at ad spend. That gives you a dangerously optimistic CAC. We're going to be thorough.
Here’s a look at their Q3 spending:
- Marketing Team Salaries: Three marketers cost the company a combined $60,000 for the quarter.
- Sales Team Salaries & Commissions: They have four sales reps, and their combined salaries plus commissions hit $95,000.
- Paid Advertising Spend: Their total budget for Google Ads and LinkedIn Ads was $50,000.
- Marketing & Sales Software: You have to account for the tools. Subscriptions for their CRM, email platform, and SEO tools added up to $7,500.
- Content & Creative Costs: They paid freelance writers and a video agency $12,500 for blog posts and a new demo video.
- Agency Retainer: They also have a PR agency on a retainer, which was $15,000 for the three-month period.
Now, let's get our grand total.
Total Q3 Spend = $60,000 + $95,000 + $50,000 + $7,500 + $12,500 + $15,000 = $240,000
That $240,000 represents the true, fully-loaded cost of their customer acquisition machine for the quarter. No sugarcoating.
Counting the New Customers
Next up, we need the other half of the equation: how many new paying customers did they actually bring in during Q3? For Innovate Solutions, a "new customer" is an account that signs up and makes its first subscription payment between July 1st and September 30th.
After pulling reports from their billing and CRM systems, they confirmed they acquired 300 new paying customers in that window.
It's true that some of the marketing efforts that landed these customers might have started in Q2. That "time lag" is normal. But for this foundational CAC calculation, we keep things clean by tying the costs and the resulting customers to the same time period.
Putting It All Together: The Final CAC
We have our two key numbers. Time to do the math.
CAC = Total Sales & Marketing Spend / New Customers Acquired
CAC = $240,000 / 300
CAC = $800
There it is. In Q3, it cost Innovate Solutions $800 to acquire each new customer. This isn't just a number; it's a powerful benchmark. They can now use this to measure if their marketing is getting more or less efficient, forecast future budgets, and honestly assess the profitability of their entire business model.
The Big Takeaway: The final $800 CAC is only meaningful because we were ruthless in tracking down all associated costs—not just the easy ones like ad spend. If you forget to include salaries or software costs, you'll fool yourself into thinking your CAC is much lower than reality, which can lead to some seriously bad strategic calls down the road.
One Pitfall I See All the Time
A frequent mistake is mismatching your time periods. For instance, if you use your Q3 marketing spend but count customers who signed up in early October, you’re muddying the waters. Your results will be skewed. For CAC to be a reliable health metric you can track over time, you have to be disciplined about keeping your cost period and your acquisition period perfectly aligned.
To make this easier, I've put together a simple spreadsheet with all these cost categories laid out. Just make a copy, plug in your own numbers, and you'll be on your way. You can grab the free CAC Calculation Template here to get started.
Advanced CAC Analysis for Deeper Insights
Calculating a single, company-wide Customer Acquisition Cost is a great starting point, but it really only tells you part of the story. Think of it as an average—it can easily hide incredible performance in one area while masking wasteful spending in another.
The real strategic power comes when you start segmenting this metric to understand the nuances of your marketing engine. This is where you move from just knowing your cost to actively managing and optimizing it. By breaking down your CAC, you can finally see which channels are your true growth drivers and which are just a drain on your budget.
This infographic lays out the core formula and the components that go into it.
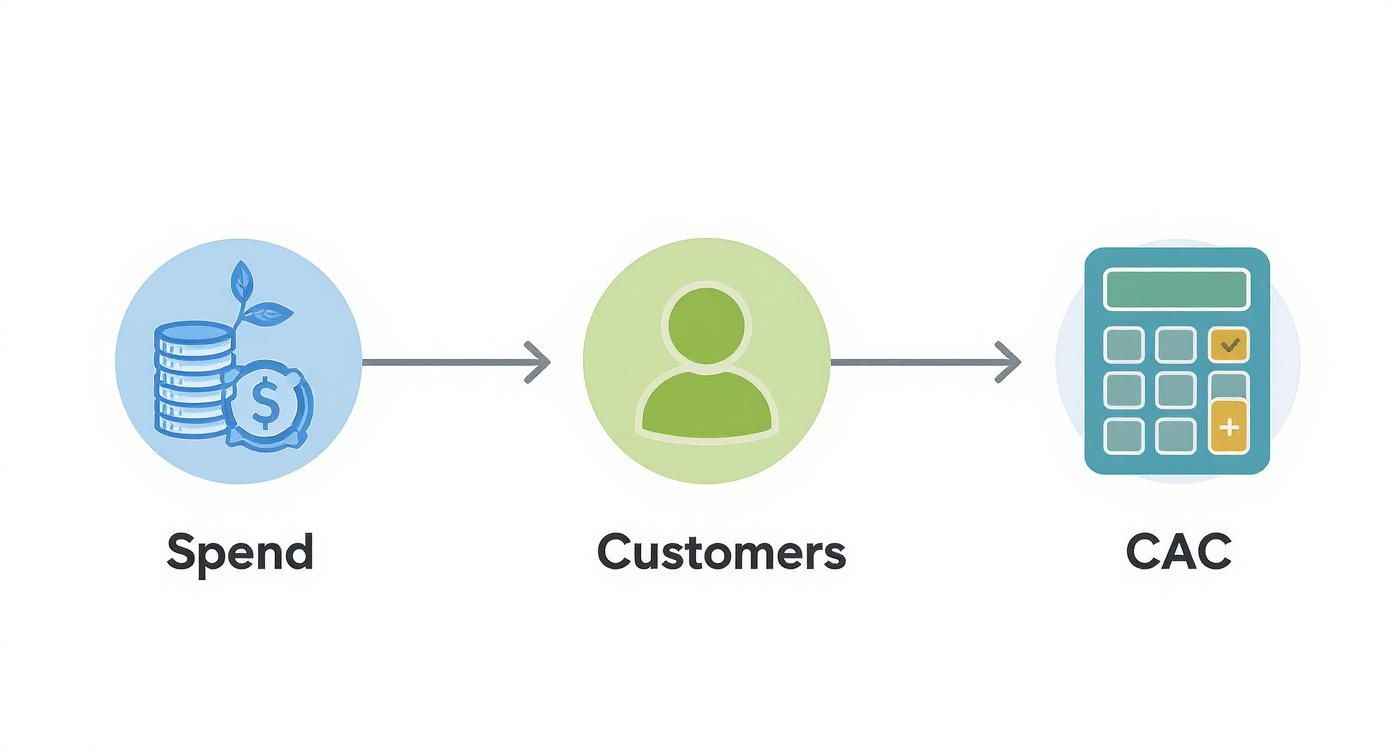
As you can see, the process is about connecting your total investment in sales and marketing directly to the new customers it brings in. That link gives you your CAC.
Calculating CAC on a Per-Channel Basis
Your blended CAC is useful for a high-level view, but a channel-specific CAC is what's truly actionable. You absolutely need to know if the money you're pouring into Google Ads is more or less efficient than your content marketing efforts. Answering that question is the key to reallocating your budget with confidence.
To do this, you have to meticulously attribute your costs and new customers to their specific sources. It definitely requires more granular tracking than a blended CAC.
Here’s a practical way to approach it:
- Isolate Channel Spend: Tally up every cost directly tied to a single channel. For Google Ads, this isn't just the ad spend; it includes agency fees and a portion of the salary for the person managing the campaigns.
- Attribute New Customers: Dive into your analytics or CRM to figure out how many new customers actually came from that specific channel.
- Calculate the Channel CAC: Simply divide the isolated channel spend by the number of new customers you attributed to it.
For example, let's say you spent $10,000 on LinkedIn Ads in a month and acquired 20 new customers directly from those campaigns. Your LinkedIn CAC would be $500. This kind of focused view immediately reveals which channels are your true money-makers.
To illustrate, here's a sample breakdown that shows how different channels can perform.
Sample CAC by Marketing Channel
This table provides a hypothetical look at CAC across different marketing channels. It quickly becomes clear where your investment is most (and least) effective.
| Channel | Total Spend | New Customers | Channel CAC |
|---|---|---|---|
| Google Ads | $15,000 | 75 | $200 |
| SEO/Content | $5,000 | 50 | $100 |
| LinkedIn Ads | $10,000 | 20 | $500 |
| Affiliate Program | $2,500 | 25 | $100 |
Looking at this data, you can see that SEO/Content and the Affiliate Program are the most efficient channels at $100 per customer, while LinkedIn Ads are the most expensive. This is the kind of insight that should drive your next budget meeting.
Introducing Cohort Analysis for Trend Spotting
Another powerful technique is cohort analysis. Instead of looking at all customers acquired in a given period, you group them into cohorts—usually based on the month or quarter they signed up. Calculating CAC for each cohort helps you spot crucial trends over time.
You might find that the cohort of customers you acquired in January had a CAC of $50, but the June cohort cost you $90 to acquire. What happened? This could signal rising ad costs, market saturation, or a decline in campaign effectiveness that a simple blended CAC would have completely obscured.
Cohort analysis transforms your CAC from a static number into a dynamic story. It shows you the direction your acquisition efficiency is heading, giving you an early warning system to address problems before they escalate.
The Critical Role of Attribution Models
So, how do you give credit for a conversion? Your attribution model dramatically impacts your channel-level CAC calculations. The model you choose determines which touchpoint gets the credit, which can fundamentally change which channels appear most effective.
There are several common models to consider:
- First-Touch Attribution: This model gives 100% of the credit to the very first marketing touchpoint a customer interacted with. It’s fantastic for understanding which channels are best at generating initial awareness.
- Last-Touch Attribution: The most common model out there. It gives all the credit to the final touchpoint before conversion, highlighting which channels are good at closing deals.
- Multi-Touch Attribution: These models (like linear or time-decay) distribute credit across multiple touchpoints in the customer journey. This provides a much more balanced view of how all your channels work together.
Your choice of model is a big deal. A company using last-touch might find their branded search ads have an incredibly low CAC, while a first-touch model might show that their blog content is the real, unsung hero. For a more detailed breakdown, you can learn more about how to approach cross-channel marketing attribution in our complete guide.
The right model really depends on your business goals, but understanding how each one works is essential for an accurate and insightful analysis. This context is also important when you're comparing your numbers to industry benchmarks, as costs can vary wildly. For instance, the average B2B SaaS company might spend $536 per customer, while fintech companies can see CACs as high as $1,450. Knowing your industry's average provides a valuable yardstick for your own performance.
So, you've crunched the numbers and landed on your Customer Acquisition Cost. Maybe it's $50, maybe it's $800. Now what?
A CAC number by itself is just noise. It’s a figure floating in a void, completely meaningless without context. To turn that number into a powerful tool, you have to pair it with its other half: Customer Lifetime Value (LTV).
LTV is the total revenue you can realistically expect from a customer over their entire relationship with your brand. When you put CAC and LTV side-by-side, you get the LTV:CAC ratio—the single most important indicator of whether your business is built to last.
The LTV to CAC Ratio Explained
The LTV:CAC ratio is your moment of truth. It tells you exactly how much return you get on your acquisition spending. Think of it this way: for every dollar you put in to get a customer, how many dollars do you get back out?
Let's say your LTV is $900 and your CAC is $300. Your LTV:CAC ratio is a healthy 3:1. For every dollar you spend bringing in a new customer, you earn three dollars back over time. That’s the foundation of a scalable business. Getting a handle on this relationship is non-negotiable. To get more background on the core definition, you can explore What is Cost Per Acquisition (CPA) and see how it fits into this bigger picture.
What Different Ratios Signal About Your Business
Every ratio tells a story. It’s a direct signal from your business telling you what’s working, what's broken, and where you need to focus your energy.
- A 1:1 Ratio: This is a five-alarm fire. You’re spending a dollar to make a dollar, which means you're actually losing money once you factor in the cost of goods and operational overhead. You’re essentially paying people to become your customers.
- Below a 3:1 Ratio: You're not sinking, but you’re treading water in a stormy sea. A ratio like this suggests your profit margins are too thin to fuel real growth. There's little left over to reinvest in marketing or cover your operating costs.
- A 3:1 Ratio: This is the sweet spot. It's widely seen as the gold standard for a healthy, profitable business. You have an efficient acquisition engine and a solid financial model.
- A 5:1 Ratio or Higher: This sounds like a dream, but it might be a sign you're leaving money on the table. A ratio this high can indicate you’re underinvesting in growth. You could likely afford to spend more aggressively to scale faster without hurting your profitability.
The goal isn't just to calculate these numbers but to use them as a compass. A healthy LTV:CAC ratio confirms your marketing is working, while a poor one tells you it's time to reassess your strategy from the ground up.
The rule of thumb across most industries is that your LTV should be at least three times your CAC. Take B2B SaaS, for example. The average CAC can be around $536. For a sustainable model, those companies need to be aiming for an LTV of at least $1,608 to hit that crucial 3:1 balance.
If you find your ratio is only 2:1, it’s a clear sign you either need to fix your acquisition channels or put a serious focus on improving customer lifetime value through better retention and upselling.
Proven Strategies to Lower Your Acquisition Cost
Alright, you’ve got your CAC number. Now, let’s make it smaller. The goal isn’t just to spend less on marketing, but to spend a whole lot smarter. Every tactic from here on out is about getting more bang for your buck—either by making your marketing spend more efficient or by bringing in more valuable customers.
The quickest way to stop wasting money is to get serious about your ad targeting. A lot of brands still take a "shotgun approach," blasting ads everywhere and hoping for the best. Don't do that. Instead, dive deep into your customer data. Build laser-focused lookalike audiences and get granular with your demographic, interest, and behavioral targeting. Stop paying to show your ads to people who were never going to buy anyway.
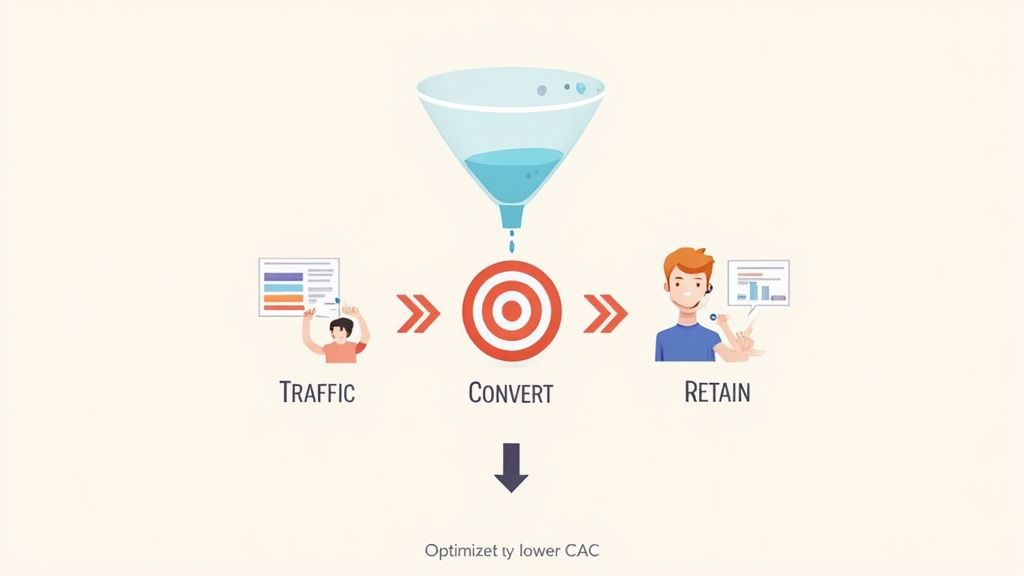
Plug the Leaks in Your Conversion Funnel
Getting traffic to your website is only half the job. If your landing pages are confusing or your checkout process is a nightmare, you're essentially lighting that ad spend on fire. Even small bumps in your conversion rate can have a huge impact on your final CAC.
Here's where to focus for the biggest wins:
- A/B Test Your Landing Pages: You have to test everything. Try out different headlines, button colors, calls-to-action, and layouts. You’d be surprised how seemingly tiny tweaks can lead to big conversion lifts, which directly cuts your acquisition cost for that channel.
- Speed Up Your Site: We all know this, but it’s still a massive problem. Slow-loading pages kill conversions. Make sure your site is snappy, especially on mobile, or potential customers will hit the back button before they even see what you're selling.
- Simplify Your Checkout: Every single field or extra step in your checkout is another chance for someone to get frustrated and leave. Smoothing out this process is critical. If you need help with this, check out this actionable guide to reducing cart abandonment.
Turn Your Customers Into Your Best Marketers
So often, the cheapest way to get a new customer is through an existing one. It makes perfect sense—your happy, loyal customers are your most believable and effective advocates.
Your best acquisition channel might not be a channel at all. It's your current customer base. Turning them into advocates through referrals is the ultimate CAC-reduction play because you’re replacing expensive ad dollars with genuine word-of-mouth.
This is exactly where a solid loyalty and referral program proves its worth. When you reward customers for telling their friends about you, you're building a growth engine that runs on its own.
A platform like Toki is built for this, letting you create structured referral programs that transform satisfied customers into a powerful, low-cost acquisition machine. It fundamentally changes your CAC by adding a highly efficient, organic stream of new business to the mix.
Getting to the Bottom of Your CAC
As you start crunching the numbers, a few questions always seem to pop up. Let's get them sorted out so you can feel confident in your calculations.
So, What’s a “Good” CAC, Anyway?
This is the big one, and the answer is always: it depends. There’s no magic number that works for everyone.
A $500 CAC could be a massive win for a SaaS company with a high lifetime value (LTV), but it would be a total disaster for an online shop selling $25 t-shirts. It's all relative.
The real acid test for a "good" CAC is how it stacks up against your LTV. The golden rule of thumb for a healthy, sustainable business is an LTV that's at least three times your CAC. This 3:1 ratio means you’re making enough profit from each customer to cover your other operating costs and actually grow the business.
Key Takeaway: A super-low CAC isn't necessarily the ultimate goal. If your CAC is almost zero, you might be underinvesting in marketing and leaving growth on the table. Focus on hitting a healthy LTV:CAC ratio, not just on slashing your acquisition spend to the bone.
How Often Should I Run These Numbers?
Calculating your CAC isn't a "set it and forget it" task. To get real, actionable insights, you need to be looking at it regularly.
Here’s a good rhythm to follow:
- Monthly: This is perfect for keeping your finger on the pulse. A monthly check-in helps you see how specific campaigns are performing, letting you tweak ad spend or targeting on the fly before a small problem becomes a budget-killer.
- Quarterly: Looking at your CAC every quarter gives you a more stable, big-picture view. It smooths out any weird monthly spikes or dips and is ideal for bigger strategic planning and reporting to investors or your leadership team.
Tracking it consistently helps you spot trends, see what’s actually working, and make much smarter decisions about where your marketing dollars go.
Ready to turn happy customers into your most affordable acquisition channel? Toki makes it easy to launch powerful loyalty, membership, and referral programs that drive growth and slash your CAC. Discover how at buildwithtoki.com.